I will pass on now to a series of three webpages from a
different website within the large NASA domain, the Earth Observatory site.
These pages are intended for a less technically expert or scientifically
knowledgeable public, as we can see by comparing its much reduced use of
technical language and complex visual displays with the pages we have just
analyzed.
http://earthobservatory.nasa.gov/Observatory/
The Earth Observatory is a website with many, presumably
deliberate, parallels to the GSFC site. Where the GSFC site is intended to allow
technically expert users to access large scientific datasets of satellite images
(clicking on one of the seven textlinks takes you to a page where you input the
parameters of the data you want and then download large amounts of coded data),
the Earth Observatory site provides a similar but greatly simplified service for
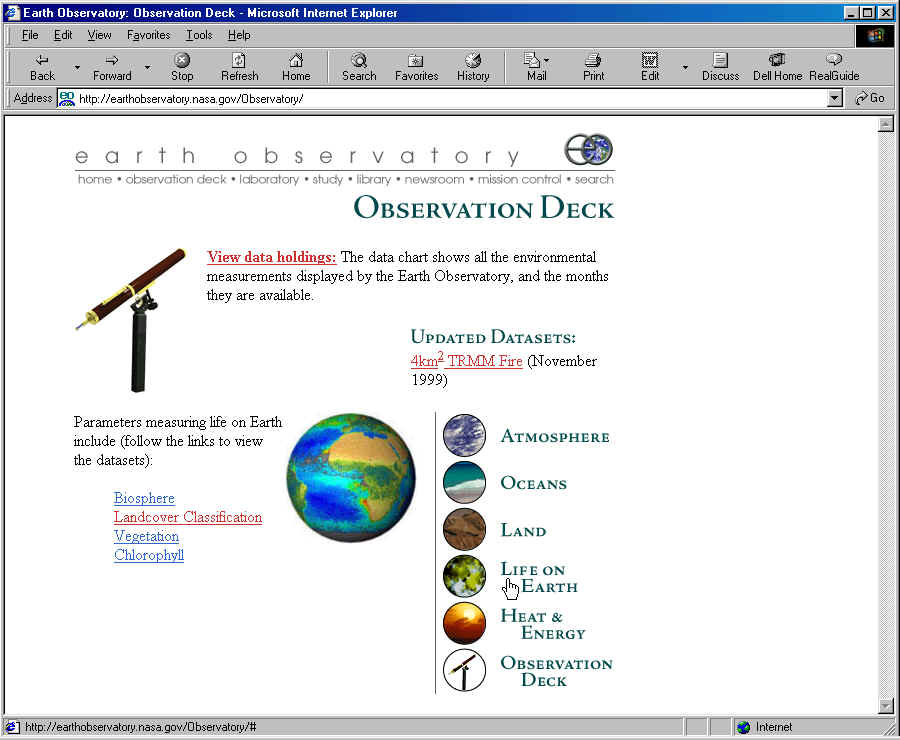
students, teachers, and the general public. The page displayed here is the
dataset portal page, very similar in content and design to the GSFC page.
This time there is a set of instructions on how to use the
mouse to activate dynamic images and lists of links to various datasets. Passing
the mouse cursor over each of the five globe icons and their brief titles at
right displays a larger more detailed globe image, presumably false-colored with
data-based information and a set of links to datasets. These are very simple
images with no captions. They are also tied cohesively to the introductory note
for each set of displayed links by a fairly trivial repetition of lexical items.
For example, the Life on Earth menu item displays text which reads:
Parameters measuring life on Earth
include (follow the links to view the datasets):
They are cohesively tied to the displayed links by
thematic collocation (‘biosphere’, synonymy; ‘vegetation’, meronymy;
‘chlorophyll’, collocation), in the same way, verbally, that the displayed
introduction and links are cohesive with each other. The menu icon and the
displayed globe image are cohesive visually only by the similarity of shape
(round) and dominant color (green). But there is a cross-modal cohesive link
between the word “earth” in the menu and image of a globe of the earth,
which one might call a cross-modal collocation, since this association is a
conventional one produced by their frequent co-occurrence in other contexts.
Structurally, we have a similar but simplied structure to
that of the GSFC page. There are two columns with a horizontal connection of
theme: topics (hyponymy or subcategorization) and a vertical list-structure with
the same sort of co-hyponymy based on the
atmosphere-hydrosphere-lithosphere-biosphere thematic formation used for the
GSFC page. The displayed introductions and links have a similar internal
structure, with a title, a specification, and the list of links. In addition
there is the co-displayed globe, organizationally suggesting a thematic tie to
the items in the list as well as the title. With this prompt, we can interpret
the Life on Earth displayed globe as showing vegetation, green with chlorophyll,
covering the landforms of Africa in an uneven way. We now read regions of the
globe image as jungles and deserts, in part because the dynamic visual
and interactive organization of the page implies a thematic relation to the
verbal items in the links list.
Orientationally, this page addresses the user verbally
through imperatives (Proposal: demand: action). The default lefthand display
gives instructions: “Click to view …” “Pass your cursor …” and the
one for Life on Earth, like the others says “Follow the links …”. This
constructs a Guide: Visitor relationship, with the author/source as more
knowledgeable, not just about the earth or NASA data, but also about the use of
the webpage itself. Otherwise we also have a [Proposal: offer: information]
orientation to the user, as with the GSFC page. In the original version shown
here, next to the telescope (a cross-modal collocational symbol of
“observatory”) we read, “View data holdings …” which we can take to be
both an offer and a demand in the sense that one can read it semantically as
“if you want to view the data holdings … click this link”. The telescope
image has cohesive ties to ‘view’ and ‘observatory’ in the visual
paired-structure that links it to the text next to it, but no other semantic
relationship.
In terms of stance to content, there is very little content
as such, so most of the evaluative dimensions are unmarked. The images show a
fairly realistic, but not high resolution image for the telescope (high
warrantability, but no importance) and a globe (for Life on Earth) that has the
same warrantability issues discussed above for the Monsoon Dynamics image.
I am more interested at this point in passing from the
analysis of multimodality, which I think is sufficiently illustrated already, to
hypertextuality. In a sense we have already seen in these dynamic pages a
measure of hypertextuality within the page frame, insofar as the mouse-over
display of images and text represents an interactive potential for
multi-sequential display to the user of lexias or meaning units. The user can
move the mouse cursor to show any of the displayed items in any order. The
meanings along such traversals, beyond those of individual displays, are mainly
cohesive: each element is an instance of some general category, and therefore
with some thematic and/or visual similarities to the others, and as we catenate
them we are cumulating toward an exhaustive exploration of the category. This is
a fairly common traversal principle in websites. We are presented with a general
theme or topic and links to subcategorized elements of it. We can examine these
in any order, but as we examine more and more of them, we construct a traversal
which is more than the sum of its parts primarily insofar as the whole also
exhausts the subcategorization structure and we find we have all the parts or
pieces.
If, however, we now accept thepage’s offer of information
and accede to the demand to click on a link, such as Vegetation under Life on
Earth, we can consider the meaning relations between this portal page and what
appears next:
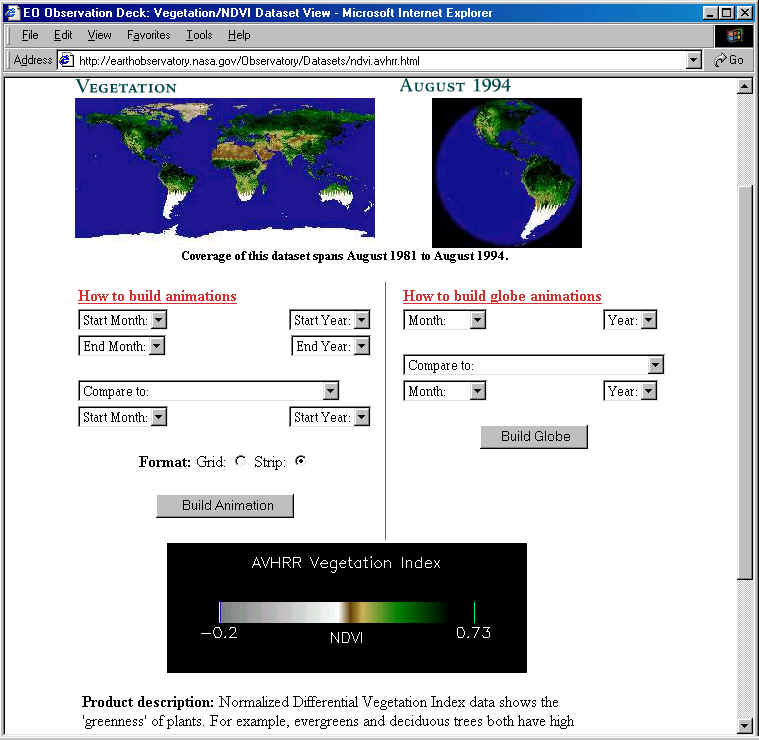
http://earthobservatory.nasa.gov/Observatory/Datasets/ndvi.avhrr.html
(since updated as http://earthobservatory.nasa.gov/Observatory/Datasets/ndvi.fasir.html )
In terms of Organizational meaning relations, we must first
recognize that the act of clicking and following the link, i.e. calling up the
display of the page is an actional-structural tie. This is similar to the
cross-textual tie we find when we turn to an indicated page from one part of a
book to another. Semantically, this is a two-part relation, in which the first
part (anchor) in this case specifies the kind of information (dataset) to be
found in the second part (target). We can consider this akin to the verbal
semantic relationship of Expansion: Elaboration (between clauses). There are
also of course cohesive ties, as we would expect. Verbally there is
‘vegetation’ and ‘dataset’ repeated on the new page. Visually, there is
another globe, and a map of the earth, both with green coloring distributed
unevenly.
This new page has a very different compositional structure,
though it can still be read as a vertical stack of information units: website
banner and menu, page title, sample visual data displays, input form to specify
a dataset, visual-numerical color key, “product description”. This is an
invariant pattern for all the dataset access pages following from the links on
the original portal page.
The page constructs a complex source: user relationship. In
addition to its implied offers of further information and demands for action
(click to follow link), it also now presents a [Proposal: demand: information]
in the guise of the input forms. This is the interactive equivalent of a verbal
question. In order to respond to this demand, we must also accede to procedural
demands for action (e.g. use a drop-down list, click on a button to submit the
data form). But we are now given a large number of choices, in effect a
combinatorial freedom, which is typical of the open web hypertext medium.
This type of author: user relationship in hypertext gives
rise to a sense of interactive dialogue. The page asks us to fill in the form,
but by filling it in and clicking one of the “Build” buttons, it is we who
are now demanding information and action, and in general the programs and
databases behind the website will accede to these demands. One could say that
this page offers the opportunity to make a demand.
The “instructional” links “How to build …” are
also interestingly complex in terms of the semantics of exchange relations. On
the surface they offer information “here is how to build …”, but they
demand an action (click the link) to get that information. When the user clicks,
s/he is not just acceding to the demand for action, but also demanding the
information, i.e. asking the question “How do I build ….” Or demanding
“Tell me how to build …”.
Within this page there are also some salient cross-modal
ties, both structural and cohesive, between the verbal text, the visual images,
and the interactive form (which is also both verbal and visual, but functionally
is a hybrid medium in its own right with different semiotic and actional
affordances from either pure written text or depictive images). The color key is
cohesively tied to the sample data display images higher up the page. It
provides an Expansion: enhancement, providing the conditions under which the
image corresponds to the numerical sattelite data. The product description is an
Expansion: elaboration of the color key, in part, and it also has cohesive
cross-modal ties to the sample data displays, inviting us to connect visual
elements to ‘greenness … soil, snow, ice …forest … crops’.
With proper attention to the organizational conventions
linking labels and titles to images and sections of text, we also find
interesting cohesive links among the sample displays, the input forms, and the
product description through terms for months and seasons: August 1994, start
month, year, summer, winter which form a classic “similarity chain” even
though this is not connected text. The chain serves to help us construct meaning
relationships among the different sections of the page. If we fill in the data
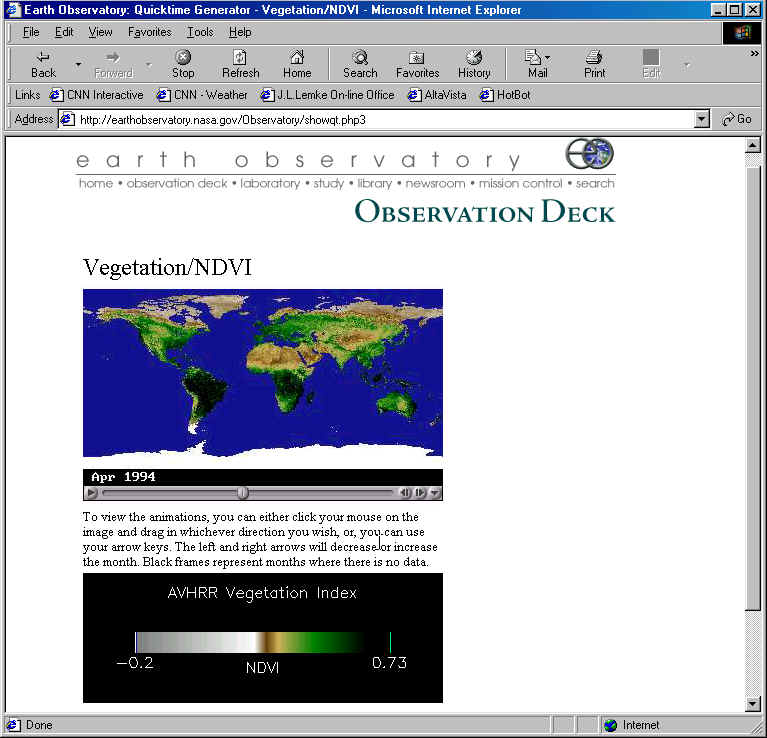
for building a “strip” animation, and click Build, the result is a
new page, not permanently on the webserver but created just for us (figure 5).
Below the usual website header and site title, there is a cohesive page title or
image label “Vegetation/NDVI”, continuing the identity and similarity
cohesion chains from the original portal page (vegetation) and the product
description and color key image elements of the previous (anchor) page.
Below this we see a Quicktime strip image in which by dragging with the
mouse along the slider bar at the bottom, we shift time backwards and forwards,
with time labels beneath the image changing to index this. The rightmost and
leftmost positions correspond to the input-form data we supplied for start
month, end month, and year(s). What we see is the same world map, but the
colorations change with the seasons. Below the animation strip-map is text which
is instructional in nature; i.e. it is about the procedures for viewing the
animated map, not about the thematic content of vegetation that changes with the
seasons.
And below this is the color key reproduced as on the previous page, and the product description repeated for reference (so you don’t have to go back and forth between pages; it is a slow process for the server to generate the strip map and for it to be downloaded and displayed by the browser client). The instructional text sets up the same sort of source: user relationship. The map image itself has the same sort of realism and resolution levels as for the sample displays on the previous page. The strip map is to be read in relation to the color key and product description as before.
What shall we say about the cross-link meaning relation of these two pages? It is again a kind of exchange relationship (orientationally): this is the server’s answer to our question, its response to our demand, which was itself an acceptance of an offer made on the prior page. The dialogue genre is extended one turn.
Organizationally, the cross-link relationship is a more complex actional-structural one than that between the portal page and the input-form page. The action is not simply clicking the Build button, but also supplying the information in the form. There will not be a strip page (but rather an error page, or no response) otherwise. So the interactive first-part of the structural pair involves supplying information as well as demanding it. The information supplied through the input-form is verbal-numerical, but its internal organizational semantics is structured by a visual table, i.e. by a layout of relations among elements similar to that of a table in a print medium. (See Lemke 1998b for a discussion of the historical and semantic relations of tables to connected text and to more graphical visual displays.)
Presentationally and thematically, the inter-page relationship would seem to be that of exemplification. The first-part page offers a template for a category of possible strip-maps, and the second-part displays one instance from this category. This is the primary meaning relationship, but secondarily one can also say that the new strip map provides an Extension: additive to the information in the sample display. As if to say: In August 1994 the world looked like this, and in other months (e.g. April 1994) it looked like this.
It would also be possible, depending on the input parameters, to obtain a relation of temporal meronymy: the sample display shows one month within the whole year (or period) which the strip-map shows, thus including it as a part.
In purely visual terms, we could compare the two strip maps (sample and animation), to see a cohesive tie (the same continents and landforms) and a spatial-distributional difference in colors. There would be a very different pattern of salience and eye-movement across the two maps. How could we name their visual meaning-relation? It is somewhat akin to “morphing”, a constant general form with varying details (or the continuous passage from one image to another). It is also somewhat like the relation of theme-and-variations in music: a constant overall form, with varying lesser details. This assumes that we see, culturally, configurations of shapes and masses as more significant visually than relatively minor changes within a still relatively constant color palette. This visual relationship of the pages seems subordinated to the semantic relationships already discussed.
There is of course another visual relationship of the pages: their sequential display in the same visual space, like the frames of an animation or film. This is a dynamic visual relationship, in time more than in space, in the window of the browser.
Some hypertext systems, and even the web, can launch new windows for successor pages, and display these side by side, or in other spatial relationships. So there is a potential significance in the choice to replace one page by another in the same external visual space. This potential does not seem to be exploited here in any marked way.