FOR: JR Martin & R Veel (Eds.), Reading Science (Routledge)
MULTIPLYING
MEANING:
VISUAL AND
VERBAL SEMIOTICS IN SCIENTIFIC TEXT
J.L. LEMKE
City University of New York
Multimedia Semiotics
Scientific research articles and other genres of formal scientific communication in print rely heavily on the use of visual representations such as graphs, tables, diagrams, and drawings as well as mathematical expressions. How are these symbolic presentations integrated with those made through normally textualized verbal language? How do we make meaning with such multimedia texts? What specific kinds of meanings have these multimedia genres evolved to help us make?
In this report on my current research-in-progress (Lemke 1993a, 1994), I would like to sketch a theoretical framework for investigating these questions and communicate some very preliminary findings. I will argue that human communication normally deploys the resources of multiple semiotic systems and combines them according to essentially functional principles. Scientific communication in particular seeks to make meanings that overflow the preponderantly typological principles of linguistic semantics and require their integration with the more topological modalities of visual semiotics and their extension through the hybrid resources of quantitative mathematics. I will also report the results of two preliminary surveys of the types and frequencies of non-textual presentations in formal scientific print communication and offer some semiotic analyses of the functional (presentational, orientational, and organizational) integration of text, tables, graphs, diagrams and drawings in these multimedia genres.
Social semiotics seeks to explicate how we make meaning with all the resources at our disposal: linguistic, pictorial, gestural, musical, choreographic, and most generally actional (e.g. Halliday 1978; Hodge & Kress 1988; Kress & van Leeuwen 1990; Lemke 1987, 1990, 1995a; O’Toole 1990, 1994; Thibault 1991). The most fully developed analysis so far is that for the deployment of linguistic resources in the construction of meaning in verbal text and discourse (e.g. Halliday 1985; Halliday & Hasan 1989; Lemke 1995a, 1995b; Martin 1992). But we never make meaning with language alone.
Meaning-making is always a material process as well as a social semiotic practice (Lemke 1984, 1993b, 1995a); as such it cannot be adequately understood in terms of any one semiotic modality, such as language. The acoustic soundstream of speech can not only be analyzed into linguistically distinctive features and units, which enable different voices to be heard as saying the same word, but in it we can equally hear those linguistically non-distinctive features that enable us to distinguish one individual voice from another, or a light-hearted from a melancholy speaking of the same words.
Languages, or linguistic semiotic resource systems, are analytical abstractions from embodied social practices: from material speakings and writings and the activities that provide the contexts on which their cultural meanings depend. Speech always co-deploys at least paralinguistic, and normally visual-gestural semiotic resources as well. Writing always deploys a visual graphological-typographical semiotic as well as that of language. In countless texts and acts of meaning-making the members of a community simultaneously use language and the semiotic systems of depiction and graphics, movement and gesture, music, fashion, food and every other mode of socially meaningful action in their culture.
Language co-evolved with other modes of meaning-making; it evolved to function in co-ordination with all aspects of our construction of meaning through semiotically mediated action and active perception. Speech co-evolved as part of interactional synchrony: the bodily and material integration of individual organisms into their ecosocial environments. The intonational patterns of speech and the musical patterns of song descend from common ancestral modes of behavior. The synchrony, not just in individuals but across dyads and groups, of verbal action with other body movements and rhythms signals the participation of gesture and movement in the unitary communication system from which we abstract the semiotic patterns we call language or gesture (cf. Kendon 1990, Scheflen 1975). Our perception as well as our production of semiotic interaction makes use of visual and kinesthetic information and responsiveness as much as it does of the auditory channel.
In writing, ontogeny shows what phylogeny would tell us if it could: that writing and drawing also share common ancestry; that each generation must be taught anew to make the separation between them. Writing is not merely the annotation of speech, as drawing is not simply the inking of images. Drawing begins as the extension to paper of gesture, as the product of lasting visual traces of our gestures in acts which are indiscriminately gesturings and drawings (cf. Arnheim 1956, cited in Kress & van Leeuwen 1990: 25). And these are accompanied you can be sure by vocalizations which are not as distinct from other gestures as the abstractions of linguistics and the ideology of intellectual verbalism dispose us to believe. It is not surprising that children do as one act what adults have been taught to separate into two: drawing and writing (cf. Dyson 1991; Hicks & Kanevsky 1992). Like our first drawing, our first writing is not a representation of speech, but an extension of it that produces a lasting visual trace.
In the progressive cultural differentiation of the action-stream of communication and its lasting traces into speech, gesture, writing, and drawing there is a loss of unity, but there is also a semiotic gain. By a general process, common in development and evolution, and sometimes called semogenesis (Halliday 1975, 1992), when an original unity becomes semiotically construable as being composed of separable units, those units become free to combine in new ways, making new meanings possible, and the culture is then free to evolve new restrictions on these combinations, endowing them with yet another dimension of meaning (as "indices" of some situation-type or subcommunity; Lemke 1993b). When writing is distinguished from drawing, it becomes possible to compose multimedia texts, incorporating both semiotic modalities, and allowing us to multiply the meanings made with one by those made with the other, provided our community has established conventions for how to read such multimedia genres.
Multimedia Genres in Science
Natural science is preeminently a discourse about the materiality of the world. Because it is a discourse and a system of interdependent social semiotic practices and activities of many kinds united by discourses, science works to bridge the gulf between the analytical meaning systems of our culture and the underlying material processes by which we as organisms interact with and are integrally part of a physical, biological, ecological world. The materiality of physical processes is what overflows analytical categorization, for unlike semiotic reality, physical reality is not defined by difference but by interaction. Semiotic systems like language make meaning by combining differences, by making analytical-categorial distinctions and then distributing distinctive sign-bearers in non-random ways. But there is another kind of meaningfulness in which we participate through our material being: the interactions with environments that make us what we are, that enable us to live, grow, develop, and surprise ourselves. (This model of material semiotics and ecosocial systems is developed further in Lemke 1995a.)
In its efforts to describe the material interactions of people and things, natural science has been led away from an exclusive reliance on verbal language. It has tried to find ways to describe continuous change and co-variation, in addition to categorial difference and co-distribution. It has tried to describe what we know through our perceptual Gestalts and motor activities, to construct representations of the topological as well as the typological aspects of our being-in-the-world. Language and other typologically oriented semiotic systems have not evolved in this way. Language is unsurpassed as a tool for the formulation of difference and relationship, for the making of categorical distinctions. But it is much poorer (though hardly bankrupt) in resources for formulating degree, quantity, gradation, continuous change, continuous co-variation, non-integer ratio, varying proportionality, complex topological relations of relative nearness or connectedness, the interpenetration of different dimensionalities, or nonlinear relationships and dynamical emergence.
But all these things can be enacted operationally through other forms of human motor activity, in the laboratory, or just in our normal biological ways of interacting with our environments (cf. Lemke 1996). We can indicate modulation of speed or size, or complex relations of shape or relative position, far better with a gesture than we can with words, and we can let that gesture leave a trace and become a visual-graphical representation that will sit still and let us re-examine it at our leisure. The dynamical aspect lost in the static graph is recovered in the visual simulation or animation, which we can repeat at will, speed up or slow down and freeze in time. Visual representations present events, happenings, doings in ways which retain their topological and dynamical character. Verbal representations do not do this. Vocal representations, as in speech performances, do retain aspects of the flow, the modulation of pacing and intensity of events (cf. Hymes 1981; Bourdieu 1972, 1990), but they do so through the motor dimensions of speech, not its specifically linguistic ones. (For related arguments see Bateson 1972, or in Wilden 1980, on the relations of "analogue" and "digital" communication, Thom’s 1975 discussion of "structural stability" and "morphogenesis," or Peirce’s 1955 discussion of iconically and indexically based semiosis vs. symbolic meaning.)
When we investigate the ebb-and-flow of material phenomena, we not only need to represent them but also to analyze our representations. Our tools of analysis are the predominantly typological ones of language and the semiotics of categorical distinction in other modalities. The system of discourses and allied practices that constitutes science as a social network of activities and actors (Latour 1987) has historically evolved a new semiotic modality to bridge betweent the typological and the topological: mathematics. Mathematics has its origins in natural language, but everywhere that natural language was semantically weak for purposes of representing the features of material processes of practical interest to our ancestors, mathematics extended its categories (non-integer numbers and ratios, quantitative relationships, variables, functions, infinitesimals, topologies, etc.) and made possible the kinds of meanings that could have one foot in each camp. They could vary continuously like visual and motor processes and graphical representations, but they could also be integrated into verbal text and discourse in ways these could not.
Science is not done, is not communicated, through verbal language alone. It cannot be. The "concepts" of science are not verbal concepts, though they have verbal components. They are semiotic hybrids, simultaneously and essentially verbal-typological and mathematical-graphical-operational-topological. The actional, conversational, and written textual genres of science are historically and presently, fundamentally and irreducibly multimedia genres. To do science, to talk science, to read and write science it is necessary to juggle and combine in canonical ways verbal discourse, mathematical expression, graphical-visual representation, and motor operations in the "natural" (including human-as-natural) world.
When scientists think, talk, work, and teach (cf. Lemke 1987, 1990; Ochs et al. in press -a, -b) they do not just use words; they gesture and move in imaginary visual spaces defined by graphical representations and simulations, which in turn have mathematical expressions that can also be integrated into speech. When scientists communicate in print they do not produce linear verbal text; they do not even limit their visual forms to the typographical. They do not present and organize information only verbally; they do not construct logical arguments in purely verbal form. They combine, interconnect, and integrate verbal text with mathematical expressions, quantitative graphs, information tables, abstract diagrams, maps, drawings, photographs, and a host of unique specialized visual genres seen nowhere else.
I have recently made some preliminary surveys of professional scientific print publications to sample the relative frequency and common types of non-verbal-textual semiotic expression. Here are some of the results:
Survey I
23 articles and chapters (341 pages in total):
- All feature articles from Bull NY Acad Med 68(3) 1992
(4 articles on biomedicine, 1 on urban language diversity)- 1 research off-print on cellular development
- All chapters from a conference proceedings on applications of
chaos theory in ecology, medicine, astronomy, physics- 1 book chapter on ecological succession (advanced treatise)
- 1 lengthy journal review article on thermodynamics
- 1 advanced textbook chapter on nonlinear dynamics
Average length 14.8 pp.
Average graphics 16.2 per article
Average per page: 1.1
Maximum 4.3 per page.Articles with equations, 17.
Average length 14.9 pp.
Average equations 20.8 per article
Average per page: 1.4
Maximum, math intensive, 3-4 per page.
Counted as graphics were all figures, tables, charts, graphs, photographs, drawings, maps, and specialized visual presentations. Mathematical equations were not counted in this total and are reported separately in these statistics. Only mathematical expressions set off typographically from running text were counted. Mathematical expressions are often directly integrated into a line of running verbal text, and into its syntax, which may be extended in register-specific ways beyond the syntactic possibilities of other registers.
The clear finding here is that there is typically at least one and often more than one graphical display and one mathematical expression per page of running text in typical scientific print genres. There can easily be 3-4 each of graphics displays and mathematical expressions separate from verbal text per page. (It is actually unusual to find high concentrations of both equations and graphics in the same article or on the same page. Experimental-empirical reports tend to have more graphics, theoretical analyses more equations.)
Survey II
Part A. All 20 articles from 2 issues of Physical Review Letters (62 pages total)
Average length: 3.1 pp
Total graphics, 76.
Average per article, 3.8;
Average per page, 1.2
Maximum 2-3 per page.Total equations, 169.
Average per article, 8.5
Average per page, 2.7
Maximum, in theoretical articles, 6-7 per page.
Part B. All 31 Technical Reports from 2 issues of Science (74 pages total)
Average length: 2.4 pp.
Total graphics, 187
Average per article, 6.0
Average per page, 2.5
Total equations, 13
[only 3 articles used equations, 4.3 per article, 1.9 per page]
Total tables, 39
Average per article, 1.2Total graphs, 30
Average per article, 1.0Visuals (excludes math and tables):
- Average per article, 4.7
- Average per page, 2.0
Physical Review Letters is probably the single most prestigious journal in the physical sciences. It accepts only brief reports of major new findings (experimental or theoretical) for rapid publication. Each typical 3-page article integrated four graphical displays and eight set-off mathematical expressions. Some had as many as three graphical displays per page of double-column text, or as many as seven equations per page.
Science is, alongside its British counterpart Nature, the corresponding journal for the biological and earth and space sciences. Each of these publishes longer feature articles as well as news items, all of which were excluded to achieve comparability to PRL. Mathematical expressions were less frequent in Science (only 10% of articles, all of them in non-biological subjects, included any equations), but visual presentations other than Tables, such as photographs, molecular diagrams, etc. were more common. A typical page has two non-tabular visual-graphical representations integrated with the verbal text. Each short (2.4 page) article typically has six graphics, including at least one table and one quantitative graph.
These were very preliminary surveys. There are considerable difficulties in deciding in practice how to count visual and mathematical presentations (count all lines of mathematics, or only separately numbered equations? count all graph lines in the same figure or only the figure as a whole? count combined tables separately or as a unit?). In all cases the statistical estimates given are conservative in the sense that almost any other counting choices would increase the frequency of mathematical and visual-graphical elements per article and per page.
To appreciate the absolutely central role of these non-verbal textual elements in the genres being characterized, it may help to ponder a few special (but hardly unique) cases:
Presentational, Orientational, and Organizational Meaning
How are we to analyze the ways in which verbal text and mathematical and visual-graphical media combine in scientific genres? Within what theoretical framework can we examine how people make meaning by linking text and figure, sentence and equation, caption and photo? I have already suggested that the possibility of functionally integrating language, drawing, diagrams, pictures, and mathematics arises from their common origins in material human communication processes and their long co-evolution with one another in the uses we have historically made of them in our culture.
More specifically, I believe that all meaning-making, whatever semiotic resource systems are deployed, singly or jointly, has become organized around three generalized semiotic functions (Lemke 1989, 1990, 1992, 1995). When we make meaning we always simultaneously construct a "presentation" of some state-of-affairs, orient to this presentation and orient it to others, and in doing so create an organized structure of related elements. (For more detailed discussion of these presentational, orientational, and organizational functions, see below.) When we do this, as nearly as is possible, entirely with the resources of language, then these functions correspond to the ideational, interpersonal, and textual linguistic "metafunctions" of Halliday (1978). When we do this in "talking science" (Lemke 1990) or in any other specialized linguistic register (Gregory 1967, Halliday 1978), we deploy some of the resources for each function with greater and others with lesser frequency (Halliday 1991). Moreover, as Martin (1991, 1992) has emphasized, we form particular, culturally typical combinations of meanings about things, attitudes toward them and our addressees, and ways of organizing our language, which in effect constitute the genres of a discourse community (see also Hasan 1995, Lemke in press -a,-b; Bazerman 1988 for additional views of the relations of genres and social meaning).
Let’s consider just a bit more of what we know about functional integration in linguistic meaning as a background for the more general case of multimedia semiotics. Linguistically we have evolved more than just functional combinations, we have evolved typical discourse formations and stylistic strategies, which give these combinations a sense of familiarity even when their content is novel (cf. Kress & Threadgold 1988; Lemke 1988, 1991, 1995a, in press -a, -b). We use texts already in circulation, and discourse resources of the order of text (typical stories, typical patterns of scientific explanation, typical progressions of metaphors) as resources for making meaning, every bit as much as we use more formal, paradigmatic, system-like resources such as lexicogrammar or the semantic options for speech acts.
A clause or sentence means not just through the selections it makes in these systems, but through its place in a larger text organization and its intertextual relations to other texts (Lemke 1985, 1988a, 1988b, 1995a, 1995b). It means something not just through its own selections, but through how those selections continue or develop the selections of prior clauses (and may be reread in light of subsequent ones; cf. Halliday 1982, Lemke 1991). Moreover, ideational-thematic (presentational) meanings contribute to organizational-textual ones (e.g. through cohesion and cohesive harmony, cf. Halliday & Hasan 1976, 1989; Hasan 1984; Lemke 1988b, 1995b) and so do intepersonal-attitudinal ones (cf. Lemke 1992; Thibault, in press, on global modal programs). Likewise, organizational meanings contribute to ideational ones by defining clauses, clause-complexes, rhetorical structure units (e.g. Lemke 1988b, 1990, in press -a, -b; Mann & Thompson 1986), and larger units of intratextual relationship, and in similar ways to the interpersonal and attitudinal texture of a text. Ideational choices of lexis, in turn, inevitably contribute to the attitudinal stance of a text to its audience, to its content, and to other text-embodied viewpoints. Conversely, we read the ideational meaning of a text differently depending on our interpretation of its ironies and other attitudinal features.
In these ways and many others, the meaning of the linguistic text is the product of the subtle, conventional and creative interplay of presentational, orientational, and organization aspects of meaning-making. How much more so is this true when we take into account the co-deployment of visual, gestural, graphical, mathematical, and other resource systems! Each of these semiotic systems provides resources specialized for each of the three generalized semiotic functions. When the resources of multiple semiotic systems are codeployed:
In multimedia genres, meanings made with each functional resource in each semiotic modality can modulate meanings of each kind in each other semiotic modality, thus multiplying the set of possible meanings that can be made (and so also the specificity of any particular meaning made against the background of this larger set of possibilities).
This combinatorial semiotic principle provides not just a theoretical framework, but an analytical engine for investigating multimedia semiotics. It poses for us the possibilities and the questions, what to look for and where to look. We will find some of the possibilities realized in some genres and not in others, in some texts perhaps and not in others. Just as the notion of grammatical metaphor (Halliday, 1985, this volume) shows us how our meaning-making potential is enlarged when verbal resources normally used for one function (e.g. nouns for Things) are deployed also for another (nouns for Processes, which thereby become semiotically both in some ways Thing-like while in others still Process-like, a new semiotic hybrid reality), so the principle of functional cross-multiplication in multimedia genres shows us how we can mean more, mean new kinds of meanings never before meant and not otherwise mean-able, when this process occurs both within and across different semiotic modalities (i.e. language, visual representation, mathematics, etc.).
Because of their importance to the analysis, let me specify the three generalized semiotic functions a little further:
Every meaning-making act constructs a presentational "state-of-affairs" that construes relations among semiotic participants and processes as if they were being observed, objectively and synoptically, from some outside vantage point. In language, this is the so-called representational or propositional function (Halliday’s "ideational" or "experiential" metafunction, for which I also use the term thematic). It defines the sense in which we speak "about" something, construct a theme or topic, make predications and arguments. In less philosophical and more linguistic terms, this means that we deploy the resources of grammar and lexis to specify some process or relationship and its semantic participants (agents, patients, instruments, etc.) and circumstances (when, where, why, how, under what conditions, etc.) In visual depiction, this is the figural or representational function that presents to us a scene whose elements we can recognize and which have comprehensible relations to one another in terms of the typical scripts of that scene. This is what tells us what we are being shown, what is supposed to be "there", to be happening, or what relations are being constructed among the elements presented.
At the same time every meaning-making act constructs an orientational "stance" toward that state-of-affairs, often to indicate how true or certain the producer wishes the interpreter to take it as being, or to indicate an evaluation of it as good or bad, ordinary or suprising, necessary or obligatory, in the perspective the producer is creating for the interpreter. But orientational meaning goes naturally beyond this to also include the construction of a social relationship between producer and interpreters (present or imagined), and more generally a relative positioning of the producer and "text" (i.e. semiotic production or multimedia object) in the whole social space of possible discourses and viewpoints on the state-of-affairs. In language, this is the pragmatic or interactional function (Halliday’s "interpersonal" metafunction, including "attitudinal" meanings), through which we take a role in the communication event and construct the nature of the "speech act" we are performing (informing, querying, commanding) and the social relationship to the addressee we are enacting (bullying, beseeching, promising, threatening). This is always done in the context of larger social relations and groupings that transcend any particular communicative event or text, and against the background of the various other texts in the community constructed from other possible points of view (cf. Lemke 1985, 1993c; Bakhtin 1935/1981 on heteroglossia, and commentary in Lemke 1988a, 1995a).
In depiction, every image takes an orientational stance (O’Toole’s 1994 term is "modal") which positions the viewer in relation to the scene (e.g. intimate, distant; superior, subordinate), establishes some sort of evaluative orientations of the producer/interpreter toward the scene itself (tragic, comic; normal, surprising), and does so against the background of other possible viewpoints and depictions of similar scenes.
Finally, every meaning-making act constructs a system of organizational relations defining wholes and parts of those wholes, both in the semiotic space of the text and in the (ecosocial) interactional space of the meaning-making act itself. Language creates words-in-phrases, phrases-in-clauses, chains of reference and cohesion, and larger and subtler structures and textures of the verbal text (Halliday’s "textual" metafunction, cf. Halliday & Hasan 1976, 1989; Lemke 1988b, 1995a; Matthiessen 1992). Conversation as an activity creates in-groups and out-groups, and shifting dyads within larger groups. Depiction deploys compositional (O’Toole 1994) resources to organize the visual text into elements and regions, and to link disjoint regions by such features as color and texture. As material objects, depictions participate in interactions that define parts and unite them into wholes in the ecosystem networks where objects are viewed and used.
In recent work, Michael O’Toole (1994) and, independently, Gunther Kress and Theo van Leeuwen (1990) have demonstrated these homologous dimensions of meaning in visual semiotic productions of many kinds: paintings, sculpture and architecture; photographs, advertisements, and cinema. Kress and van Leeuwen (1990) have also considered some of the parallels between text and drawings in children’s writing. Their work clearly shows the usefulness of taking a "trifunctional" perspective such as that sketched here in visual semiotics, and the interesting similarities and enlightening differences between the specific meaning systems of these analytically distinct, and functionally and culturally specialized, semiotic resource systems and the genres we produce by deploying them.
In an early effort (Lemke 1987) I analyzed how science teachers and students made sense with each other by codeploying verbal, gestural, and pictorial resources. I found that if we regard each of these as constituting a separate "channel" of communication, then sometimes the same or equivalent information passes nearly simultaneously in more than one channel, sometimes the information in the two channels is complementary, and sometimes information comes first in one channel, and later in another. It became very clear to me that the meanings that were being constructed were JOINT meanings produced in the intersection of different semiotic systems. While it was useful to analytically separate these into different "channels," there was also an underlying unity to the meanings produced. Their separation neglects this fundamental unity of communicative meaning-making which makes the co-ordination among channels not only possible, but normal.
Genres within Scientific Text
How can we read scientific media that combine verbal text with mathematical expressions and various visual-graphical presentations? What are the component genres within such scientific texts? How are they typically integrated with one another? How, across semiotic modalities, are resources for presentational, orientational, and organizational meaning combined? Here I can only begin to point at some interesting phenomena that warrant further investigation and study.
The medium of printed scientific texts is first of all a visual one. Even the linguistic meanings are presented through the visual semiotics of orthography and typography, including all matters of page-layout as well as choices of font style and typeface sizes, the use of headings and footers, etc. It is precisely because language here is present through a visual semiotic that it is so readily integrated with other systems of visual meaning. (In face-to-face communication, where language is present in a motor-acoustic medium, it is our "vocal gestures" that are integrated with other motor gestures, some being more perceptible auditorily, others more so visually. Cf. Scheflen 1975).
Typography is quite conventionally used as an orientational as well as an organizational resource in printed text. Orientationally, the use of italic and boldface types signals emphasis or importance, as does the relative point-size of type in titles, headings, abstracts, footnotes, captions, labels, etc. Organizationally, paragraphing and sectioning of text, and geometric relations of figure space to caption space indicate to us which elements are to be preferentially read in relation to which other elements; what goes with what.
Scientific text is not primarily linear, it is not meant to be read according to a unique implied sequence and represents a primitive form of hypertext (cf. Lemke 1993d). Footnotes represent an optional branch for readers, so do figures and their captions, and the parenthetic or main-text expressions such as "(Table 3)" or "as seen in the first table" which point to them. Spoken language is linear in this respect, but no visual semiotic can be, for all are at least two-dimensional and any one-dimensional sequence represented in two-dimensions can be accessed at any point at any time. Many scientists, after reading the title and abstract, may skip to the end to see an endnote telling who supported the research or to skim the references for familiar or unfamiliar citations. They may well read the tables or graphs first, and then their captions, and only then the main text. Some may pay more attention to the equations than to the words in which they are embedded. These are the habits of expert readers, those who could themselves have written this text or one very like it.
The principal mini-genres of the scientific research article, in addition to its Main Text, include: Title, Author List, Author affiliations or addresses, Abstract, Section Headings (which may be considered part of the Main Text), Figures, Figure Captions, Tables, Table Captions, Priority dates, Reference List, Footnotes/Endnotes, and Acknowledgments. Figures, as a typographical component, are regions of the page which are not set in type but produced by some more photographic or direct image-printing process. They include: Photographs, Drawings, Diagrams, Graphs, and Maps. Tables, by contrast, are set in type, and are the most text-like of the non-textual visual presentations. Almost all Figures have labels as well as captions, and often also brief textual notes printed as part of the Figure proper (legends).
Tables as Textualizable Visual Displays
Tables have their most direct origin in normal written text. They carry textual ellipsis to its greatest extreme, using visual organizational resources to enable meaning relations to be recovered from bare thematic items in the absence of grammatical constructions. There is always, however, an implied grammar, and a recoverable textual sentence or paragraph for every table. In my work on intertextual thematic formations (Lemke 1983, 1985, 1988, 1990, 1995b) originally for scientific discourse, I noted that listeners and readers are expected to be able to supply the canonical semantic relations of thematic terms, which are often underspecified or omitted. This is done by familiarity with a canonical pattern of semantic relations (the thematic formation), either from another text or discourse, or from an earlier section of the present one.
Scientific tables most often have numerical entries, though not always, and the grammar of the numerical entries is generally that of the normal nominal group, with the Head constant through a row or column of the table and written at its end, and the table entry functioning as numerative of that Head. Table I, however, shows a purely verbal table, with a brief introductory text, serving as a summary conclusion of a conference paper (Percival 1987). In the conference presentation it would almost certainly have been projected as a slide. Having read the text of the paper (excepts below), the reader would be in possession of a thematic formation whose slots could be readily filled by the pairs of entries in this two-column table. If it were glossed as full text, it might read something like this:
"In the old view of Hamiltonian dynamics [lefthand entry] was a key concept, but in the new view it has been replaced by the idea of [righthand entry]."
CONCLUSIONS
The complete change of viewpoint described earlier can now be summarized, as in table 1, showing the old ideas, and how they have been modified in the last few decades.
TABLE 1. CHANGING VIEWPOINTS IN HAMILTONIAN DYNAMICS
Old view |
New view |
| integrability | invariant sets |
| stability and instability of orbits | regular and chaotic motion |
| variational principles for orbits | variational principles for invariant sets |
| convergence of perturbation series | K.A.M. theorem and analyticity in domains |
| continuity | fractals and renomalization |
| analysis | geometry, computers, and number theory |
| determinism | probability |
[From Percival 1987: 142; reproduced by permission]
As is typical with thematic formations, there are many possible textualizations, but the underlying semantic relations among thematic items remain the same. Here is one instance of the formation from the text of the article which is being summarized in the Table:
According to one point of view, expressed by Laplace, dynamical systems are completely deterministic, so probability theory can have no relevance. But this point of view requires [an impossibility]. ... For ... [certain] systems [modern] theorists have introduced symbolic dynamics, which shows precisely how probabilities enter into deterministic dynamics. (Percival 1987, p.139-140)
It corresponds to the last pair of entries in the Table.
When numerical values are placed in a Table, it is still meant to be read, at least in principle, as full verbal text. While this convention today is so well-established that it is not in evidence in the surface forms of most Tables, a historical example shows the textual nature of Tables more clearly.
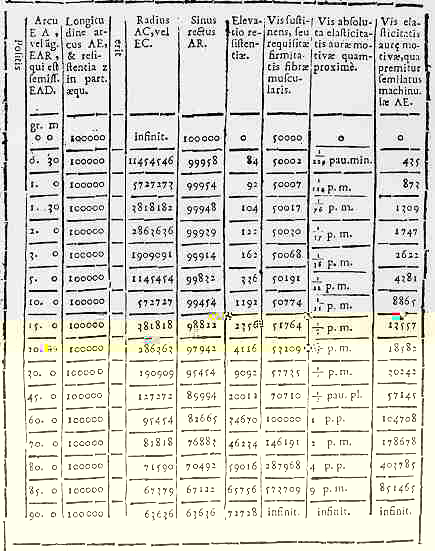
In a 1734 edition of an early treatise by Johan Bernoulli (De motu musculorum, p.464), a Table is set out giving the values of various lengths and angles resulting from a calculation of the movement of an animal’s jointed appendages subject to a certain weight, set at a certain angle (see Figure 1). There is an accompanying Figure of course to label these parameters. In the Table, we find (left-to-right) first a thin vertical column with the word "Positis" written vertically, then two columns of numbers headed "Arcu" and "Longitudine" and written in the usual horizontal way, followed by another very thin vertically ruled column containing the single word "erit" (lower case) written vertically again, and then a series of further columns of numbers headed "Radius" "Sinus" etc.
Figure 1. Table from Bernoulli (1734: 464)
[Reproduced courtesy of the New York Academy of Medicine Library]
Here we have the grammatical elements of the complete Latin sentence which can be constructed for any row of the Table: Given [Positis] arc ..., longitude ..., [then] radius, sine, etc. will be [erit] ..., ..., etc. Latin is already more sparing lexically than modern English, and there may certainly still be some ellipsis (of aequale and perhaps of et for "equal to" and "and"), but the Table has been set with the most necessary words, especially the future tense of the copula erit, to make the Table a representation of verbal text. (The inflections on Positis, arcu, longitudine are all ablative case, appropriate to textual grammar, as opposed to the nominatives usual for isolated headings.)
In a modern Table (Figure 2, from Martikainen 1993), we find a mixture of textual entries and numerical ones, including the "Tree Stand" entries which preserve the nominal group form. Nowhere in the Main Text of this article do we find a sentence that textualizes any row of this Table, but no competent reader of the text would be unable to do so. What is important to notice here is that the Table makes sense precisely because it is textualizable, i.e. because there is a thematic formation in this community, intertextually available, which enables readers to make specific semantic relations between "4.3" and "pH", "Drained" and "Virgin", "Tall Sedge Fen" and "Total N in peat".

Figure 2. Table 1 from Martikainen et al.
(1993: 52)
[Reproduced from Nature, by permission]
The important visual resources here, apart from the orthography of words, numbers, special symbols and abbreviations, are organizational ones, arranging in vertical columns and horizontal rows the semantically homogeneous (and therefore contrastable, comparable) items, and the semantically heterogeneous (and therefore combinable, presentationally interdependent) items, respectively. We can read the Table either for information about a site, for comparison of sites, to see the range of variation in a site-feature across sites, or to look for co-patternings. The topological meanings represented by decimal fractions and percentages as measurements of continuously varying physical quantities have been integrated visually as well as implicitly linguistically with the typological categories of this register. (Note, by the way, how the semantics of standard grammar is extended in delicacy by such quantitative expressions as "a tree stand of 50 cubic meters of wood per hectare" or "a rate of emission of nitrogen oxide of 0.143 grams of nitrogen per square meter per year.")
A relevant bit of the Main Text reads: "... the higher tree growth in the minerotrophic sites [fn8] (Table 1) had increased evapotranspiration and contributed to the lower water table (Fig. 1a-c)." In this one compound clause we are referred to a citation for the published details on the sites, to the Table for the "higher tree growth" at the "minerotrophic sites", and to the Figure for graphs of water table levels over time. Even when we refer to Table 1, we need to look to a footnote within the Table caption, hung on the Header text "Site number and type [*]", to identify which sites are "minerotrophic," and recognize this as a classifier in contrast with "ombrotrophic." The visual organizational conventions here are critical to following the verbal presentational argument. We could even pick up the -trophic contrast by noting the positions of these words as Headers for two columns of graphs in Figure 2. The graphs also show "error bars" indicating the reliability or warrantability, and so probability of error, in the data: a visual presentation of a mathematical formulation of an orientational meaning.
Abstract Graphs and Diagrams
It is not very far historically from a Table with numerical, or repeated symbol, entries, to a primitive bar-graph, and from there to a line-graph. Even Cartesian line-graphs and their corresponding mathematical functions can to a certain extent be "read" as text insofar as the axes have numerical scales, allowing the graph to be read as a geometrical condensation of a Table like that in Bernoulli, "when x has the value ..., y will have the value ...." This is certainly true for data-graphs, but even here, visual semiotics begin to allow us to see "trends" and "functional dependencies" in the data, which no textualization of it as information would lend itself to so directly. We apprehend the "patterns" in the data when displayed as a graph differently than we do when it is displayed as text, or even as a Table.
Such patterns are important in the value-scheme of natural science. Mathematical functions abstract these patterns from the data and even the variables, the thematic items, the measured phenomena among which they are the patterns. In scientific theory, patterns are generated from assumptions. Initially these are verbal-semantic statements, then they are mathematical expressions and/or graphical images or imagined or displayed dynamical simulations, but always primarily of quantitative patterns and covariations, the very things language has not evolved to present very well. So, in addition to mathematical expressions, scientific practice makes use of abstract graphs which only show conceptual relations, and not actual data. Here we leave behind any possibility of textualization as for Tables, but now there is a new sort of textualization possible, by way of mathematics. The abstract graph has a mathematical formulation, and that in turn is rooted in an extension of the semantics of natural language and its grammar.
Abstract graphs are more nearly pictures than text. Or they sit about mid-way. If we begin from the other end of the typology (text and verbal semantics) to topology (continuous variation and interaction) line, we must start from our visual perception of real objects, and then their holographic or photographic representation. A photograph can be abstracted into a drawing (with third-dimensional perspective or without), and from the drawing it is only a few more steps to the abstract diagram, which is still interpreted as if it were a drawing or a photograph or a visual percept. For each step we foreground some features as more important, as more significantly in contrast with potential alternatives and so more in need of specification, or else by mere convention we let the part stand for the whole, we suggest a whole, which the reader must supply, fitting intertextual (inter-pictorial?) information to the presumptive pattern. This is not at all unlike the corresponding process with thematic formations for verbal meaning.
Abstract diagrams and abstract graphs are sufficiently close in their visual semiotics that they can be directly combined visually and read as two parts of the same visual presentation. As an example, consider Figure 3 (from Berge et al. 1984: 84). The fine horizontal dotted lines visually integrate (organizational function) the abstract graph at right with the abstract diagram at left. This is possible here because one of the variables, z, in the graph is a measure of spatial position, and the scale of the graph has been set to correspond exactly to the visual representation of the same spatial distance in the diagram. But otherwise we are still in two visual worlds on the two sides of this Figure. At the left the bold arrow of "g" points down to indicate the pull of gravity and the horizontal dimension is still spatial. At the right, "z" on its vertical axis is only an arbitrary, scaleable measure of spatial position, oriented to "real space" only by the visual connection here (and by the conventional use of the co-ordinate name "z" for vertical positioning); the horizontal direction now represents the value of the temperature of places with vertical position "z", it is not spatial at all, except metaphorically.
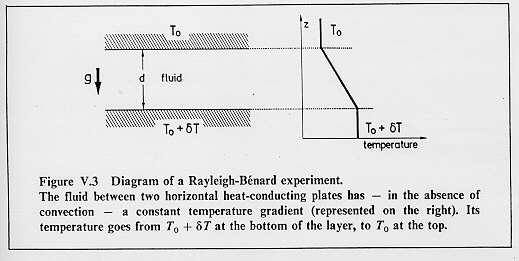
Figure 3. Figure V.3 from Berge et al. (1984:
84)
[Reproduced by permission]
On the same page of this text appears footnote 58 (Figure 4), which is both textually linked to, and visually echoes, the diagram portion of Figure 3. The diagram is rotated by 90 degrees, exchanging vertical for horizontal and vice versa. This change would not matter at all to the meaning of an abstract graph, but in this case the diagram is once again oriented on the page to "real space" with the force of gravity still acting down, even though the meaning of the downwards arrow is now ambivalent (the footnote text refers to both the fall of the liquid and to the force, gravity, which produces that fall). The full meaning of footnote 58 requires an integration of presentational, orientational, and organizational contributions from its diagram, the footnote text, the main text, and its relation to the diagram portion of Figure 3.

Figure 4. Footnote 58 from Berge et al. (1984:
84)
[Reproduced by permission]
The abstract graph portion of Figure 3 is itself a visual metaphor, showing a relation between position and temperature as if it were a shape in space, something that might be gestured and understood as a relationship among possible positions or motions. It brings to problems of continuous co-variation in all sorts of phenomena our intuitions and perceptual pattern-recognition capacities for spatial-motor phenomena. Those intuitions are supplemented by the mathematization of the abstract graph, itself an extension of an original, textualizable description of numerical data to a pure mathematical abstraction of pattern. Mathematics is more powerful than visualization, even though it is less intuitive, because it can represent patterns that cannot be visualized, and allow them to be compared, manipulated, combined, etc.
The abstract graph in this Figure is not mathematized in the text because it is much too simple. Any competent reader could do the mathematization immediately, but does not need to because this pattern is so familiar that it also has a verbal textualization, e.g. "The temperature rises linearly with depth in the fluid from To to To+dT." Or any one of many thematically equivalent textualizations, such as: "The temperature is directly proportional to depth in the fluid," or "The temperature decreases linearly with height in the fluid," or "There is a linear vertical temperature gradient in the fluid, with the bottom at higher temperature." Any competent reader could draw a substantially identical graph, or write the equivalent equation, from any of these verbal statements. The abstract thematic formation which unites all these representations is semiotically multimodal, as it is in principle for all scientific concepts and their relationships.
Figure, Caption, and Text
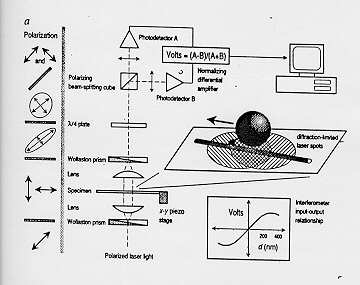
Consider, as a final example, Figure 5, which reproduces Figure 1 of an article from Nature on the spontaneous movement of a biological molecule, kinesin (Svoboda et al. 1993). Careful inspection will show a subdivision, visually and by labels, into Figures 1a, 1b, and 1c (as they are labeled in the original), of which the latter two are of the data-graph genre, and Figure 1a is an extraordinarily complex visual integration of abstract diagrams and relatively abstract drawings of several sorts, as well as one semi-abstract graph. Important as visual codes, especially presentational and organizational ones (orientational ones, too) are to the interpretation of Figure 1a, it could not be readily interpreted without substantial reliance on thematic formations formulated in the semantics of natural language and indexed by the verbal labels in the Figure. For many of these, recourse to at least the caption text, and perhaps to the Main Text, is necessary, as well as prodigious intertextual connections to complete the formations and unpack their thematic condensations (Lemke 1988a): all that is left unsaid for the expert reader.
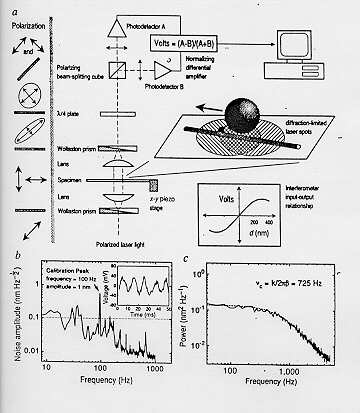
Figure 5. Figure 1 from Svoboda et al. (1993:
723)
[Reproduced from Nature, by permission]
Quite apart from the complexities of the implicit mathematizations here, there are some very simple questions about how scientific texts are to be read so as to canonically combine Figures with Captions with Main Text. When we read the Main Text, there are references outward to the Figures, such as "(see Figure V.3)". We need to use verbal thematic formations at that point to construct meaning connections between the Main Text from which we have come and what we find in the Figure. Those connections are most readily made either through the Labels in the Figure or through the intermediary of the Caption text. Captions as extensive as this one (equivalent to almost a full page of Main Text) are somewhat unusual; it contains a great deal of very important information necessary for the interpretation of the Main Text, which certainly has major thematic gaps without it. In fact the visual Figure itself is probably necessary for an interpretation of the Main Text adequate to the purposes of professional readers, and this is not at all unusual. Visual figures in scientific text, and mathematical expressions also, are generally not redundant with verbal Main Text information. They do not simply "illustrate" the verbal text, they add important or necessary information, they complement the Main Text, and in many cases they complete it.
I want to consider here only a few points concerning the ways in which visual semiotics contribute to and interact with verbal semiotics in constructing presentational, orientational, and organizational aspects of the meaning of this multi-semiotic text. Accordingly, I will begin from the Figure rather than from the Main Text, and refer first to text from its Caption and only then to Main Text. My comments are based on an extensive analysis of the visual-verbal relations among these elements.
Since we have concentrated so far more on presentational and organizational aspects of meaning in these scientific texts, let me here begin with orientational aspects. Orientational meaning includes (1) the stance or attitude a text seems to take to its own presentational content (e.g. warrantability, importance, desirability, usuality); (2) the stance it takes to prospective readers/viewers (users; e.g. solidary or antagonistic, deferential or condescending), including their anticipated attitude to the presentational content; and (3) the orientation of the text to other possible attitudes and viewpoints in the intertextual community (e.g. opposed, allied, complementary). Orientations to users can be analyzed by considering what the text seems to construct as its ideal prospective user, e.g. what the user is expected to know or be able to construe, what the user’s expectations and attitudes are likely to be. Scientific research articles generally construct users as highly knowledgeable in relevant technical matters, and mildly critical or skeptical, especially of warrantability claims, but also of importance claims. It is generally assumed that text-voice and user-stance share the same values as to what is desirable in scientific research.
The orientational attitudes to presentational content which are most salient in this genre are evaluations of warrantability, usuality or surprisingness, and importance. Desirability is generally backgrounded since it is assumed not to be in contention between text-voice and user-stance. It does however appear to mark this presumptive solidarity (see also Lemke 1988a). Consider some of the ways in which importance is constructed visually in Svoboda et al.’s Figure 1.
Importance is generally signalled by various conventions of visual prominence (see analyses by Kress & van Leeuwen 1990, O’Toole 1994, Arnheim 1956, Tufte 1983), one of which is relative size.
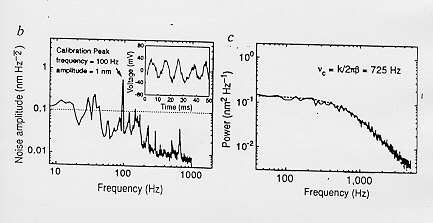
Thus among the graphs in Figure 1, the inset graph in 1b is much smaller in scale than the other graphs and is thus marked as of less importance, particularly relative to the larger graph in 1b.
In the Caption Text for 1b, there is a title, followed by two sentences (27 words) on the larger graph, and then one (10 words) on the inset graph. In the Main Text, a paragraph begins with reference to the larger graph (one sentence), and then a sentence on the inset graph follows. To understand why text and users would evaluate the inset graph as of lesser importance requires intertextual reference to the canons of experimental science regarding the best measures of instrument sensitivity and the most honest and revealing ways to display data on this important issue (important for the warrant of experimental claims made by using the instrument).
In fact, rhetorically, a major claim of this article is not just for its factual findings, but for the "advantages" (p.722, a rare explicit claim of Desirability) of its instrumental design over those in use by other researchers. This in turn accounts in part for the visual prominence of the whole of Figure 1, which is quite visually striking as a composition compared to typical diagrams of experimental apparatus, as well as for the prominence of 2b, which has a high visual density (compare 2c) and such additional highlights as the arrow pointing to the peak of the graph.
When reading 2b, the two most important
visual features, relative to the claim for sensitivity of the
instrument, are the downward trend of the graph and the fact that
it lies mostly beneath a dotted line (visually foregrounding a
fact that would be evident without this feature) representing a
10:1 signal-to-noise ratio. The inset graph not only provides
subsidiary information, it also presents it in a way that makes a
strong visually intuitive case for the irrelevance of noise in
the signal, even though canonically the main graph is considered
the more reliable measure of this effect. The inset is
"icing on the cake", a sort of intuitive backup to the
more technical evidence of the main graph it accompanies.
It is interesting that while the expert reader can get far more from the main graph, its implications for the issue of sensitivity are more indirect and must be mediated by considerable verbal discourse and reference to mathematical operations and relationships (which are provided in the caption text, in its subsidiary "Methods" section). On the other hand, the inset graph can be read topologically and intuitively as showing the relative size of signal and noise (the large wave of ups and downs is the signal, the lesser wiggles are minor distortions of it, the noise). The one shows what the other proves. A scientific understanding integrates both these modes of warrant.
The most visually prominent feature of the entire Figure is surely the abstract drawing I will call the sphere-and-rod element (in 1a), including the shaded circles and their plane just below. We need in fact some reference to organizational visual semiotics here just to determine what constitutes a likely thematic unit in this part of the page. Proximity of elements, the enclosure effect of the parallelogram, and the specifically organizational visual device of the "enlargement" or "detail" lines diverging at an angle from the specimen stage (to the left and below) contribute. The diverging lines subtend in their angle the visual unit we are describing. They also call for us to perform a very complex visual-motor operation, in imagination, to co-orient the two different visual spaces (that of the microscope stage and that of the sphere-and-rod) in a single coherent space of representation. This is a practiced operation for expert users.
 The sphere-and-rod region is
visually prominent on the page in part because it contains the
only 3-dimensional representation, as well as the largest areal
concentration of ink (especially the large dark sphere), and the
boldest surface and contrast (black-white) effects. The prominent
visual vectors (cf. Arnheim 1956) of the arrow, the
parallel line of the rod’s axis, and the near-parallel sides
of the parallelogram all contribute to the effect. Why is this
visual complex so important? Presentationally, we are seeing here
the heart of the clever design of this experiment: a silica bead
(the sphere) reflects laser light (cf. the highlight on the
sphere, the "shadows" in the plane) as it is pulled
(the arrow) along a microtubule (the rod) by a kinesin molecule
(small black blob connecting rod and sphere). The experiment is
about the properties of the kinesin molecule, and the main claim
is about how this molecule moves along a microtubule, but it is
not the biological molecule that is visually prominent here (you
might mistake it for a slip of the draughtsman pen), it is the
"optical trapping interferometer", the clever
experimental design to study the molecule indirectly by observing
the bead.
The sphere-and-rod region is
visually prominent on the page in part because it contains the
only 3-dimensional representation, as well as the largest areal
concentration of ink (especially the large dark sphere), and the
boldest surface and contrast (black-white) effects. The prominent
visual vectors (cf. Arnheim 1956) of the arrow, the
parallel line of the rod’s axis, and the near-parallel sides
of the parallelogram all contribute to the effect. Why is this
visual complex so important? Presentationally, we are seeing here
the heart of the clever design of this experiment: a silica bead
(the sphere) reflects laser light (cf. the highlight on the
sphere, the "shadows" in the plane) as it is pulled
(the arrow) along a microtubule (the rod) by a kinesin molecule
(small black blob connecting rod and sphere). The experiment is
about the properties of the kinesin molecule, and the main claim
is about how this molecule moves along a microtubule, but it is
not the biological molecule that is visually prominent here (you
might mistake it for a slip of the draughtsman pen), it is the
"optical trapping interferometer", the clever
experimental design to study the molecule indirectly by observing
the bead.
As in all semiotic constructions, the visual qualities of an element mean in relation to those of other elements, especially those in the same presentation. All visual presentational forms in Figure 1 are highly abstract. The most recognizable is the schematic drawing of a computer, which is reduced in relative importance despite (or because of) its likely visual interest, by being small in scale compared to the sphere-and-rod drawing, and rendered only 2-dimensionally. Abstract as these drawings are, they still show what counts in our culture as pictorial representation. By contrast, the "optical bench" representation (elements such as lenses, stacked vertically and connected by dashed line, to the right of the long gray vertical dividing bar at left) and its continuation at the top into an electronic circuit schematic ("photodetector" "amplifier") are purely abstract diagrams. They too could have been presented in more realistic renderings, or even in a photograph.
At the far left we find an echo of the optical bench elements marking off the stages of transformation of the polarization of the laser light as it passes through the various lenses and prisms. The arrows and arrows-and-ellipses are conventional symbolic representations of polarization, descended from actual graphs. The lens or photodetector symbols follow arbitrary conventions, one residually iconic. The algebraic symbols of the Volts formula (boxed, top center) descend from words and sentences of natural language, represented here by the orthography of the near-by word-labels. We have here a large swath of the spectrum from visual-pictorial representations to verbal-semantic ones. They have been visually integrated (organizationally) and modulated for relative importance (orientationally).
Note that the organizational aspects of this Figure, what we need to know in order to construe its wholes and parts, its sequences and internal relationships, depend not just on visual information and conventions. Much of the interpretation depends on thematic (presentational) information from the verbal text, or verbal intertexts, in some cases mediated by mathematical operations. This is also true in reverse. Figure 1c provides a view of data on the basis of which the weak forces with which the beads were "trapped" by the beams of laser light could be calculated. The relevant Caption Text reads " ... [the bead’s] brownian motion [was] recorded, from which a power spectrum was computed. The corner frequency provides the ratio ... [needed for the calculation]." The corresponding Main Text has: " ...[bead] dynamics corresponds to brownian motion ..., which has a lorentzian power spectrum. Experimental spectra are well fitted by lorentzians, and the corner frequency provides the ratio ... [needed]."
Inspection of Figure 1c, even without a
knowledge of the mathematics of the lorentzian function or its
canonical graphical forms, indicates visually what must be meant
by the "corner frequency" and lets us interpret the
legend on the graph as telling us that 725 Hz is the exact
frequency at which we can see the graph of the power spectrum
suddenly bending, as if around a corner. On the one hand we could
interpret "corner frequency" merely as a quirky name
for an algebraic parameter in an equation (for the lorentzian
function), but the expert user here is expected to also
interpret it visually, and perhaps physically, in terms of the
shape of the graph, and in terms of the randomized motion to
which it corresponds. Some users will rely more on one
realization of the underlying multimodal thematics (verbal,
mathematical, visual, physical), others on another, and the same
user may shift and combine these as the situation requires.
Making Meaning with Multiple Semiotics
I will not provide the details here for lack of space, but it is quite possible, working from the Caption Text (and, with fewer points of direct correspondence, from the Main Text) to establish item by item correspondences between verbal elements and structures and visual ones in the Figure, particularly for the description of the passage of light (and so of information about the bead and kinesin molecule) in its various states of polarization along the optical bench to the electronic analyzer. This shows particularly well how the user must integrate visual and verbal realizations of objects, concepts, relations, and processes in the joint interpretation of text and figure. On the basis of this and similar analyses, it seems most reasonable to assume a joint visual-verbal thematic formation as the basis for interpretation, integration, and intertextual (and interpictorial) contextualization in making sense with multimedia texts of this kind. Thus, the "concept" of polarization, for example, must have not only a verbal semantic component, based in its canonical semantic relations to its usual collocates and contrast items (cf. Lemke 1983, 1990), but it must also have a visual-presentational component with similar relational meaning, as well as a mathematical component, and a technical-operational (sensorimotor) one, in order to be canonically useful in making meaning with a multimedia scientific article such as this.
It is sometimes argued that the various representations of a "concept" are entirely "redundant" with one another, that they can be placed in one-to-one correspondence, so that meanings that can be made in one semiotic modality can be equally well made in the others. This is not the way scientific communication appears to work: meanings are made by the joint codeployment of two or more semiotic modalities, and such codeployment of resources is needed for canonical interpretation. In my opinion, semiotic modalities (e.g. language, depiction) are essentially incommensurable: no verbal text can construct the same meaning as a picture, no mathematical graph carries the same meaning as an equation, no verbal description makes the same sense as an action performed. As with all abstractions, we learn how to construct relations and connections among these different semiotic acts and their traces; we learn how to count them as the same for some restricted purposes. But insofar as their meanings are not determined entirely by these correspondences with one another, but also by their relations to other forms within their own semiotic (picture to picture, and word to word; cf. Saussure’s valeur principle), even what they mean within these correspondences adds specificity of meaning in each semiotic modality beyond the common meaning shared across modalities.
"Concepts" as they are used in scientific communication, and in scientific work generally, are not defined by the common denominator of their representations, but by the sum, the union of meanings implied by all these representations. Nothing is really being "re-presented" here; there is no separate entity, no pure mental idea, apart from the meanings made with the specific material systems of semiotic resources our culture provides us with. What we call the abstract concept is only a shorthand for a multimodal semiotic construction, a simultaneous and multiply articulated cluster of interdependent practices. At the level of specificity that matters here, the different semiotic constructions that together and in relation to one another constitute "the concept" have nothing in common; there is no common denominator, and certainly no higher Platonic idea of which they are each pale shadows. It is in the nature of scientific concepts that they are semiotically multimodal in this sense, and this may well be true in other systems of semiotic practices as well.
When we investigate how meaning is made, we can no longer assume that actual social meanings, materially made, consist only in the verbal-semantic and linguistic contextualizations (paradigmatic, syntagmatic, intertextual) by which we have previously defined them. We must now consider that meaning-in-use organizes, orients, and presents, directly or implicitly, through the resources of multiple semiotic systems. What the logocentrism of a few prominent genres of purely verbal text (e.g. unillustrated novels, academic articles in philosophy and the humanities) has distracted us from, perhaps the pervasive multimodal disposition of scientific and technical text can remind us of. As computer technologies make multimedia genres more convenient and accessible for all purposes, it will become increasingly important to understand how the resources of different semiotic systems have been and can be combined.
What the careful study of linguistic semiotics has taught us about semiotics in general must now be extended to other semiotic systems and modified appropriately to their specificity. Language, for all its power, has had relatively little to tell us about topological, as opposed to typological, modes of meaning-making. We understand far too little about quantitative and mathematical meaning, about affective and bodily meaning, about dynamic and emergent meaning, about all the dimensions of material interaction and social being that are not well represented in categorial terms.
Language, and typological modes of semiosis generally, have evolved to work in partnership with other, often more topologically grounded, semiotic systems. It is my hope that by studying scientific and computer hypermedia genres, we can explore the powerful mysteries of that partnership in order to better understand just how we make sense of our world and ourselves.
REFERENCES
Arnheim, R. (1956). Art and Visual Perception. London: Faber.
Bakhtin, Mikhail Mikhailovich. (1935). Discourse in the novel. In M. Holquist, Ed. The Dialogic Imagination (1981). Austin TX: University of Texas Press.
Bateson, G. (1972). Steps to an Ecology of Mind. New York: Ballantine.
Bazerman, C. (1988). Shaping Written Knowledge. Madison, Wis.: University of Wisconsin Press.
Berge, P., Pomeau, Y., & Vidal, C. (1984). Order Within Chaos: Towards a Deterministic Approach to Turbulence. New York: Wiley.
Bernoulli, Johan. (1734). De motu musculorum. Bound in Giovanni Alfonso Borelli, De motu animalium. Neapoli [Naples]: Felix Mosca. [Item 105 in the Cole Collection of the New York Academy of Medicine Library.]
Bourdieu, P. (1972). Outline of a Theory of Practice. Cambridge: Cambridge University Press.
--- (1990). The Logic of Practice. Stanford CA: Stanford University Press.
Dyson, A.H. (1991). Toward a reconceptualization of written language development. Linguistics and Education, 3, 139-162.
Gregory, M. (1967). Aspects of varieties differentiation. Journal of Linguistics 3: 177-(198.
Halliday, M.A.K. (1975). Learning How to Mean. London: Edward Arnold.
--- (1978). Language as Social Semiotic. London: Edward Arnold.
--- (1982). The de-automatization of grammar. In J. Anderson, Ed., Language Form and Linguistic Variation, pp.129-159. Amsterdam: John Benjamins.
--- (1985). An Introduction to Functional Grammar. London: Edward Arnold.
--- (1991). Towards probabilistic interpretations. In E. Ventola, Ed., Recent Systemic and Other Functional Views on Language. (pp. 39-62). Berlin-New York: Mouton/deGruyter.
--- (1992). "How do you mean?" In M. Davies and L. Ravelli, (Eds.), Advances in Systemic Linguistics: Theory and Practice. pp. 20-36. London: Pinter.
Halliday, M.A.K. and R. Hasan. (1976). Cohesion in English. London: Longman.
--- (1989). Language, Context, and Text. London: Oxford University Press.
Hasan, R. (1995). The conception of context in text. In M. Gregory and P. Fries, Eds., Discourse in Society: Functional Perspectives. Norwood, NJ: Ablex Publishing.
--- (1984). "Coherence and Cohesive Harmony." Understanding Reading Comprehension. Ed. J. Flood. Newark, DE: International Reading Association.
Hicks, D. & Kanevsky, R. (1992). Ninja Turtles and other superheroes: A case study of one literacy learner. Linguistics and Education, 4, 59-106.
Hodge, R. & Kress, G. (1988). Social Semiotics. Ithaca: Cornell University Press.
Hymes, D. (1981). In Vain I Tried to Tell You. Philadelphia: University of Pennsylvania Press.
Kendon, A. (1990). Conducting interaction. London: Cambridge University Press.
Kress, G. & van Leeuwen, T. (1990). Reading images. Geelong, Vic: Deakin University Press.
Kress, G. & Threadgold, T. (1988). Towards a social theory of genre. Southern Review, 21, 215-243.
Latour, B. (1987). Science in Action. Cambridge, MA: Harvard University Press.
Lemke, J.L. (1983). Thematic analysis: Systems, structures, and strategies. Semiotic Inquiry 3(2): 159-187.
--- (1984). Semiotics and Education. Monograph in Toronto Semiotic Circle Monographs Series, Victoria University, Toronto.
--- (1985). "Ideology, intertextuality, and the notion of register" In J.D. Benson and W.S. Greaves, Eds., Systemic Perspectives on Discourse (pp.275-294). Norwoord, NJ: Ablex.
--- (1987). "Strategic Deployment of Speech and Action: A Sociosemiotic Analysis" In J.Evans and J.Deely, Eds., Semiotics (1983: Proceedings of the Semiotic Society of America `Snowbird’ Conference (pp.67-79). University Press of America.
--- (1988a). "Discourses in conflict: Heteroglossia and text semantics." In J. D. Benson and W. S. Greaves, Eds. Systemic Functional Approaches to Discourse (pp. 29-50). Norwood, NJ: Ablex Publishing.
--- (1988b). "Text structure and text semantics" In R. Veltman and E. Steiner, Eds. Pragmatics, Discourse, and Text (pp. 158-170). London: Pinter.
--- (1989a). "Social semiotics: A new model for literacy education" In D. Bloome, Ed. Classrooms and Literacy (pp. 289-309). Norwood, NJ: Ablex Publishing.
--- (1989b). "Semantics and Social Values." WORD 40(1-2): 37-50.
--- (1990). Talking Science: Language, Learning, and Values. Norwood, NJ: Ablex Publishing.
--- (1991). "Text Production and Dynamic Text Semantics." In E. Ventola, Ed. Functional and Systemic Linguistics: Approaches and Uses. [pp. 23-38]. Berlin: Mouton/deGruyter (Trends in Linguistics: Studies and Monographs 55).
--- (1992). "Interpersonal Meaning in Discourse: Value Orientations." In M. Davies and L. Ravelli, Eds. Advances in Systemic Linguistics: Recent Theory and Practice. [pp.82-104]. London: Pinter.
--- (1993a). "Making Meaning with Language and Other Semiotic Systems" Paper presented at International Congress of Systemic and Functional Lingusitics, Victoria BC, Canada.
--- (1993b). "Discourse, Dynamics, and Social Change." Cultural Dynamics 6(1): 243-275. [Special issue, Language as Cultural Dynamic, M.A.K. Halliday, Issue Editor].
--- (1993c). "Intertextuality and Educational Research." Linguistics and Education 4(3-4): 257-268.
--- (1993d). "Hypermedia and Higher Education." Interpersonal Communication and Technology (IPCT-L@GUVM), April 1993. [To be printed in T.M. Harrison and T.D. Stephen, Eds. Computer Networking and Scholarship in the 21st Century University. Albany: SUNY Press.]
--- (1994). "Multiplying Meaning: Literacy in a Multimedia World." Paper presented at the National Reading Conference, Charleston SC (December (1993). Arlington VA: ERIC Documents Service (ED 365 940).
--- (1995a). Textual Politics: Discourse and Social Theory. London: Taylor and Francis.
--- (1995b). "Intertextuality and text semantics." In M. Gregory and P. Fries, Eds. Discourse in Society: Functional Perspectives Norwood, NJ: Ablex Publishing.
--- (1996). "Self-Organization and Psychological Theory." Review of L.B. Smith & E. Thelen, Eds., A Dynamic Systems Approach to Development. Theory & Psychology, 6(2): 352-356.
--- (in press, a). "Semantic Topography and Textual Meaning" in R. Stainton & J. DeVilliers, Eds., Communication and Linguistics. Toronto: Glendon College, York University. [Festschrift for Professor Michael Gregory]
--- (in press, b). "Typology, Topology, Topography: Genre Semantics" to appear in Network (Sydney: International Systemic Linguistics Assn.).
Mann, William and Thompson, Sandra. (1986). "Relational propositions in discourse." Discourse Processes 9(1): 57-90.
Martikainen, P.J., Nykanen, H., Crill, P. & Silvola, J. (1993). "Effects of a lowered water table on nitrous oxide fluxes from northern peatlands." Nature 366: 51-53.
Martin, J.R. (1991). Intrinsic functionality: Implications for contextual theory. Social Semiotics 1(1): 99-162.
--- (1992). English Text. Philadelphia: John Benjamins.
Matthiessen, C.M.I.M. (1992). "Interpreting the textual metafunction." In M. Davies and L. Ravelli, Eds. Advances in Systemic Linguistics: Recent Theory and Practice. [pp.37-81]. London: Pinter.
Ochs, E., Gonzales, P. & Jacoby, S. (in press, a). "When I come down I’m in the domain state ...: Grammar and graphic representation in the interpretive activity of physicists." To appear in E.Ochs. E. Schegloff, & S, Thompson (Eds.), Interaction and Grammar.
--- (in press, b) "Interpretive journeys: How physicists talk and travel through graphic space." To appear in Configurations 2(1).
O’Toole, M. (1990). "A systemic-functional semiotics of art." Semiotica 82: 185-209.
--- (1994). The Language of Displayed Art. London: Leicester University Press.
Peirce, C.S. (1955). "Logic as Semiotic: The Theory of Signs" in J. Buchler, Ed., Philosophical Writings of Peirce. New York: Dover.
Percival, I.C. (1987). "Chaos in Hamiltonian systems" in Berry, M.V., Percival, I.C. & Weiss, N.O., Eds., Dynamical Chaos. Princeton NJ: Princeton University Press. pp.131-143.
Scheflen, A.E. (1975). Models and epistemologies in the study of interaction. In A. Kendon, R. Harris, & M. Key, (Eds.), Organization of behavior in face-to-face interaction. The Hague: Mouton.
Svoboda, K., Schmidt, C.F., Schnapp, B.J., & Block, S.M. (1993). Direct observation of kinesin stepping by optical trapping interferometry. Nature 365(6448), 721-727.
Thibault, P. (1991). Social semiotics as praxis. Minneapolis: University of Minnesota Press.
--- (in press). "Interpersonal Meaning and the Global Modal Program" To appear in M. Gregory & M. Cummings, Eds. Relations and Functions Within and Around Language. Norwood, NJ: Ablex Publishing.
Thom, R. (1975). Structural Stability and Morphogenesis. Reading, MA: W.A. Benjamin.
Tufte, E. (1983). The Visual Display of Quantitative Information. Cheshire, Connecticut: Graphics Press.
Wilden, A. (1980). System and Structure. London: Tavistock.