The Goddard Site
To gain a better sense of the dimensions of increasing semiotic sophistication that are needed beyond the EO site’s level, we can turn to its sister site for professional scientists. It is not in fact easy for the casual visitor to the NASA website to find the GES DAAC. Most of the pages that are readily accessed from the NASA homepage (www.nasa.gov ) are oriented to informing the general public and have the production values of a newsmagazine or advertising poster. You can get to the EO site by looking through the prominently displayed ‘Cool NASA Sites’ on the homepage. EO can be reached by just two hypertext jumps from the NASA homepage. GES DAAC on the other hand took quite a lot of hunting to find in the absence of knowledge of the correct specialized search terms. A relatively direct path, seeking information on earth sciences data, takes six such jumps, most of them far from obvious choices in menus with several other plausible options. A slightly shorter path leads to a search engine, which, if one knows the correct technical terms, would bypass the GES DAAC and lead directly to the possibility of downloading the raw data which the GES DAAC pages describe. There is also information available on how to turn this raw data into useful visualizations, but only for those using high-end scientific workstation computers.
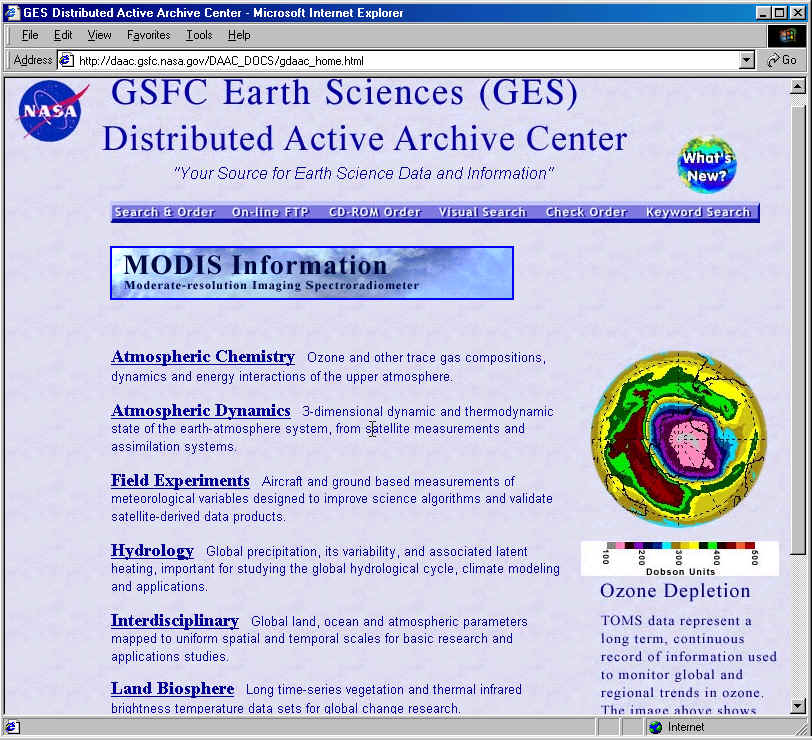
Figure 2a. NASA Goddard Space Flight Center Earth Sciences Distributed Active Archive Homepage,
Cursor over Atmospheric Chemistry link, Displaying Ozone Depletion
(January 2000, http://daac.gsfc.nasa.gov/DAAC_DOCS/gdaac_home.html)
At the Goddard Earth Sciences DAAC homepage, we
find a marvelous analogue of the EO Observation Deck page. Both contain menus of
links to information on topics such as the earth’s atmosphere, oceans,
biosphere, etc. The respective menus are:
Earth Observatory Observation
Deck:
Atmosphere – rainfall, ozone, cloud fraction
Oceans – chlorophyll, sea temperature
Land – vegetation, fires, surface temperature
Life on Earth – biosphere, vegetation, chlorophyll
Heat and Energy – surface temperature, outgoing radiation
GSFC Earth Science DAAC:
Atmospheric Chemistry
Atmospheric Dynamics
Field Experiments (meteorological variables)
Hydrology (global precipitation)
Interdisciplinary (global land, ocean, and atmospheric parameters)
Land Biosphere (vegetation and infrared brightness)
Ocean Color
On the EO page, passing the cursor over each menu item heading (at right) leads to the appearance of a colored (2-D) globe of the earth showing a typical pattern for one of the parameters under that heading and beneath it a list of links to the visualization engine for various specifically related data parameters. (See Figure 1a.)
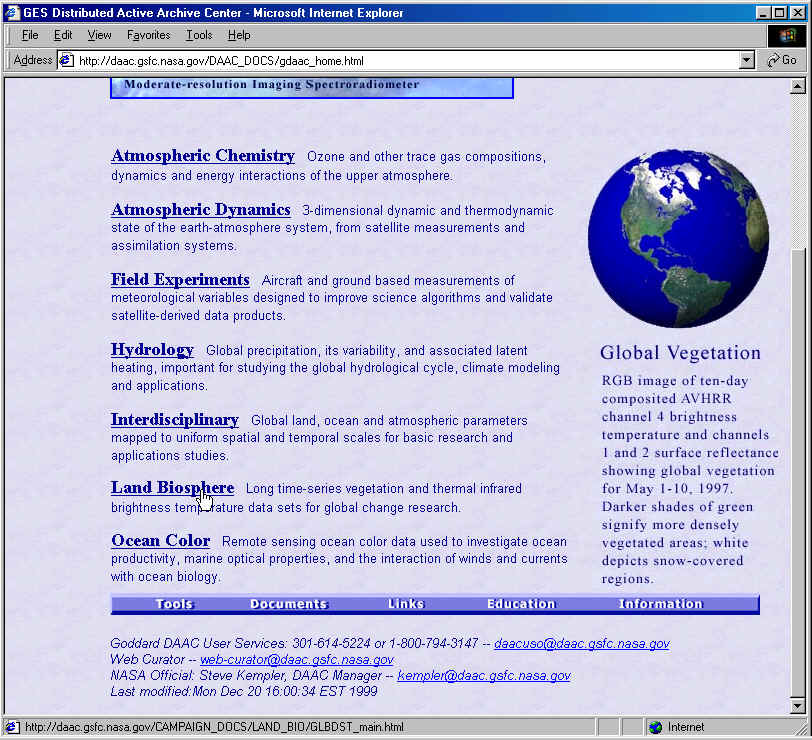
Figure 2b. NASA GSFC DAAC Homepage, Cursor over Land Biosphere link, Displaying Global Vegetation
(same URL as for Figure 2a, different cursor position)
On the DAAC page, passing the cursor over each menu item (at left) leads to the appearance in a frame on the right of a colored graphic image and paragraph long caption. The images are in two cases color-coded earth globes (Figures 2a and 2b), exactly as on the EO page, but other images include a complex data graph showing atmospheric carbon dioxide and global temperatures as a function of time (years and decades, Figure 2c) and a topographic visualization of the vector flow of air and ocean currents in a monsoon (Figure 2d). Beneath one of the globe images is a color-spectrum quantitative key for ozone concentrations (Figure 2a). The captions tend to give more technical descriptions of the nature of the data as well as of its scientific importance. On this one DAAC page the multimedia literacy demands are already in excess of those for the entire sequence on the EO site leading to interpretation of the visualized coded data maps. These users begin already past the point where the EO users end.
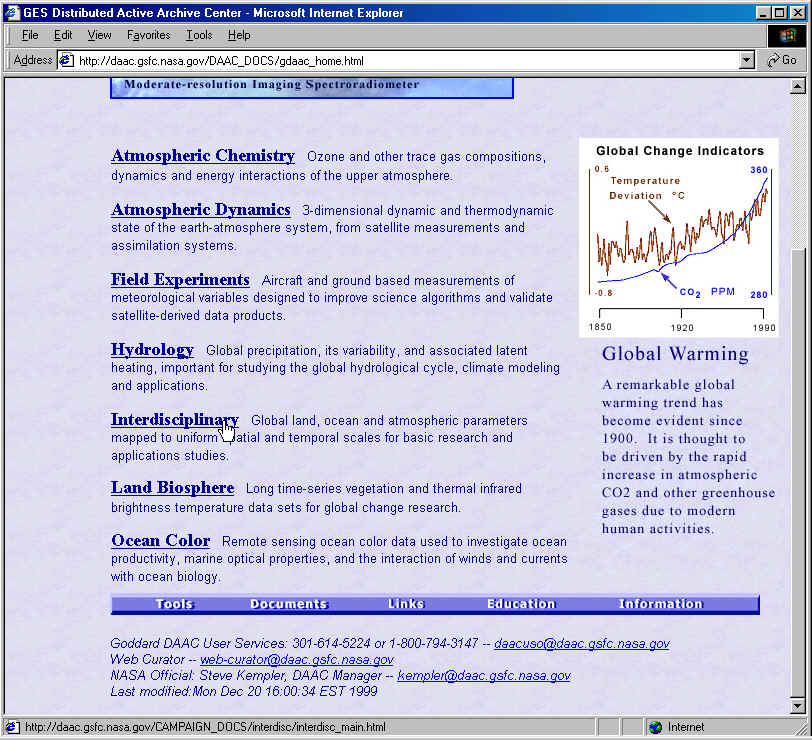
Figure 2c. NASA GSFC DAAC Homepage, Cursor over Interdisciplinary link, Displaying Global Warming
(same URL as for Figure 2a, different cursor position)
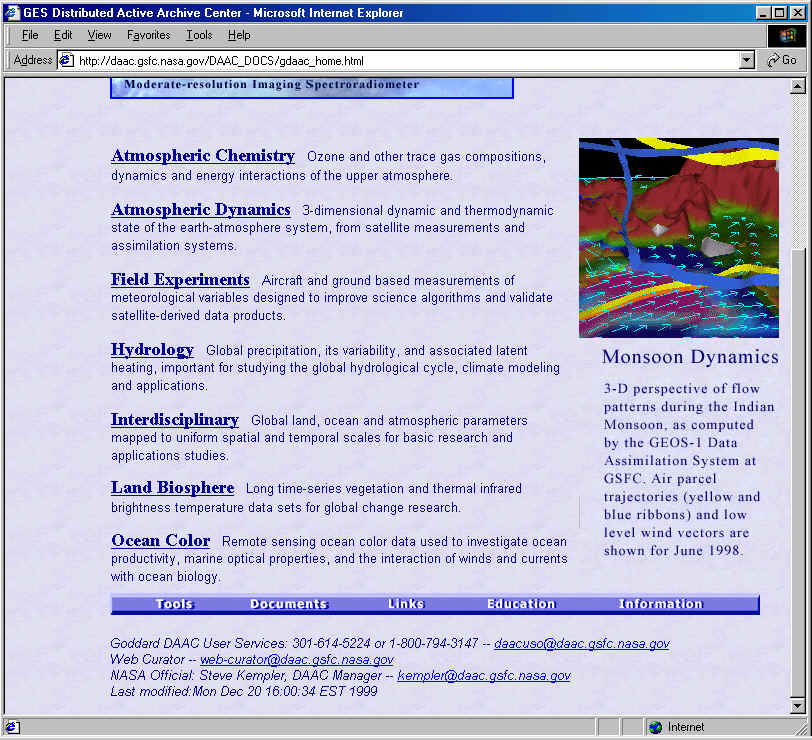
Figure 2d. NASA GSFC DAAC Homepage, Cursor over Atmospheric Dynamics link, Displaying Monsoon Dynamics
(same URL as for Figure 1a, different cursor position)