MAPS: CONTOURS, PROFILES, AND GRADIENT - Pages 45 through 58 in your lab manual |
||||
| Materials needed to complete this lab: ruler, string, and a calculator. | ||||
|
|
||||
|
|
||||
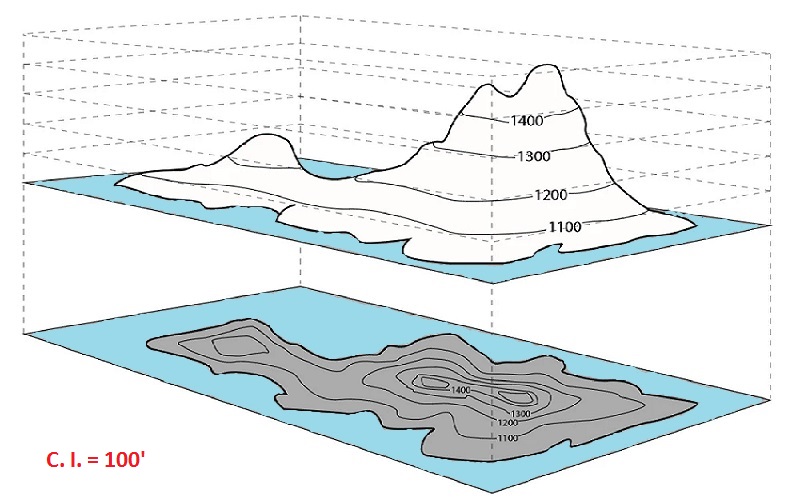
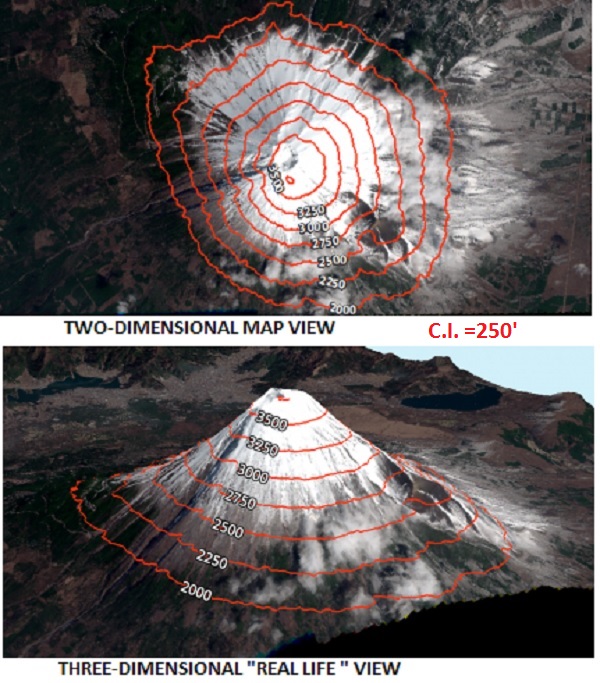
| Elevation - The Earth’s surface is highly irregular, displaying mountains, valleys, cliffs, slopes and depressions. Topographic maps employ contours as the best way of efficiently and accurately representing the three-dimensional character of the Earth’s surface on a flat, two-dimensional surface. A contour is a line on a map that connects adjacent points of equal elevation. | ||||
|
|
||||
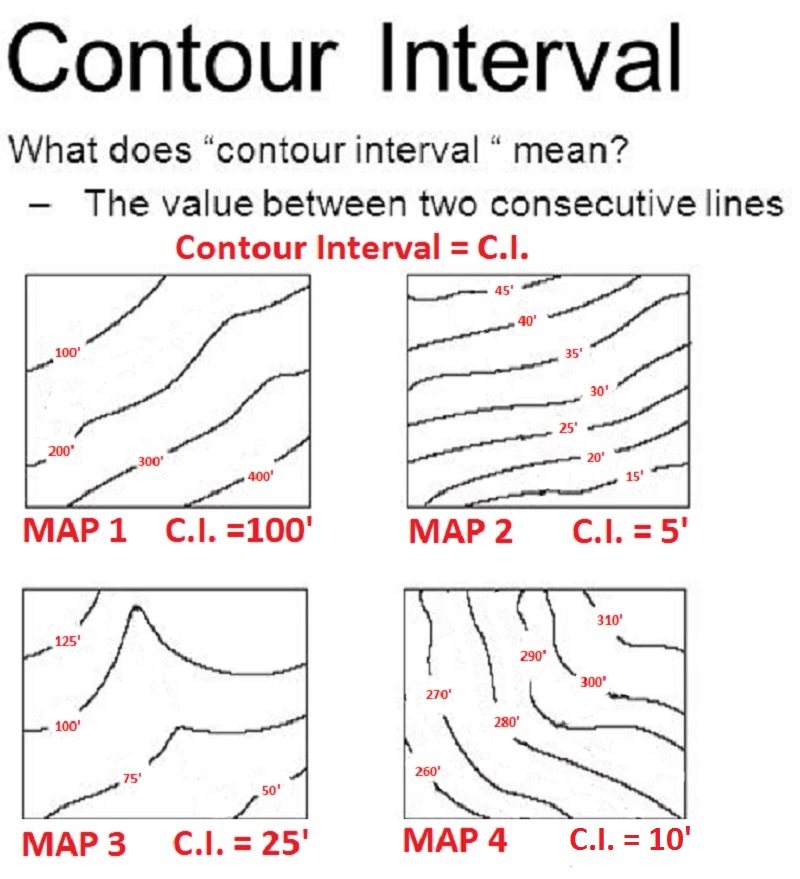
| CONTOUR INTERVAL (C.I.) - A contour interval is the vertical distance or difference in elevation between contour lines. If the numbers associated with specific contour lines are increasing, the elevation of the terrain is also increasing. | ||||
|
|
||||
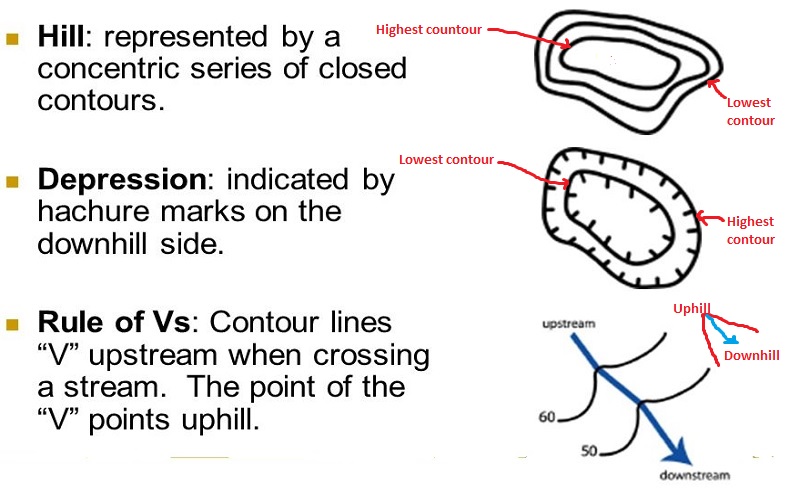
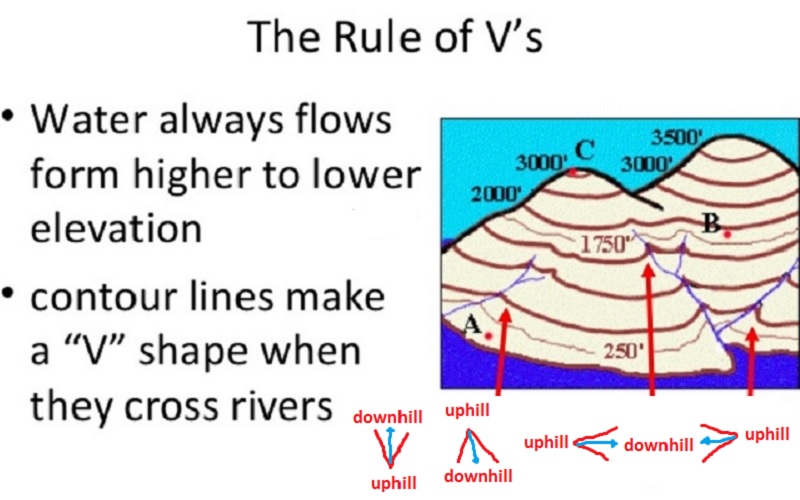
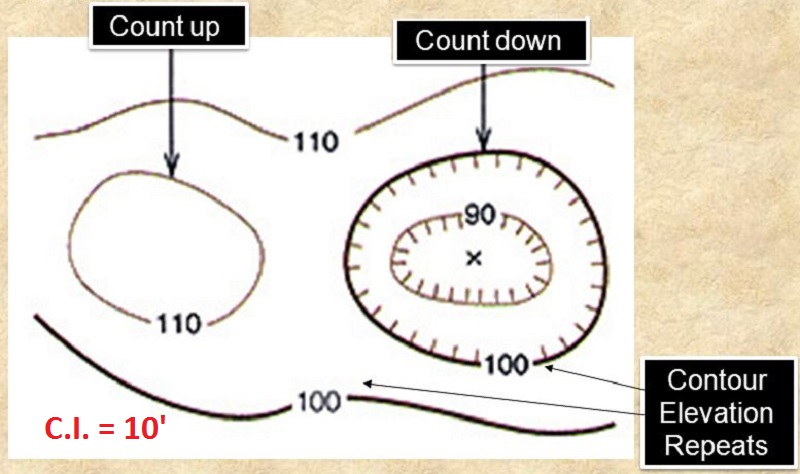
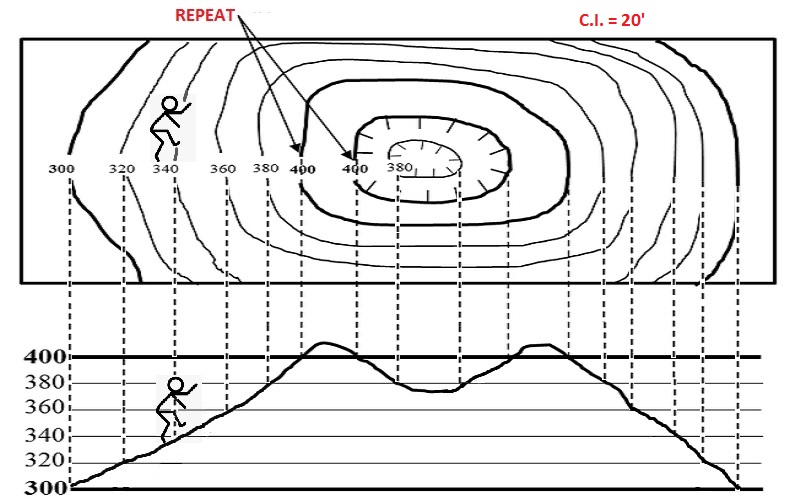
CLOSED CONTOURS - Represent hills or mountains. The inner most closed contour has the highest elevation; the outermost closed contour has the lowest elevation HACHURED LINES - Represent depressions, volcanic craters, and basins. The innermost hachured contour has the lowest elevation; the outermost hachured contour has the highest elevation. RULE OF "Vs" - Contour lines form a "V" when they cross a stream or river. The point of the V points uphill; the legs of the "V" point downhill. |
||||
|
|
||||
|
|
||||
| A hachured contour line, lying between two different contour lines, is the same elevation as the lower contour line. | ||||
| A closed contour line, lying between two different contour lines, is at a higher elevation than the lower contour line. | ||||
|
|
||||
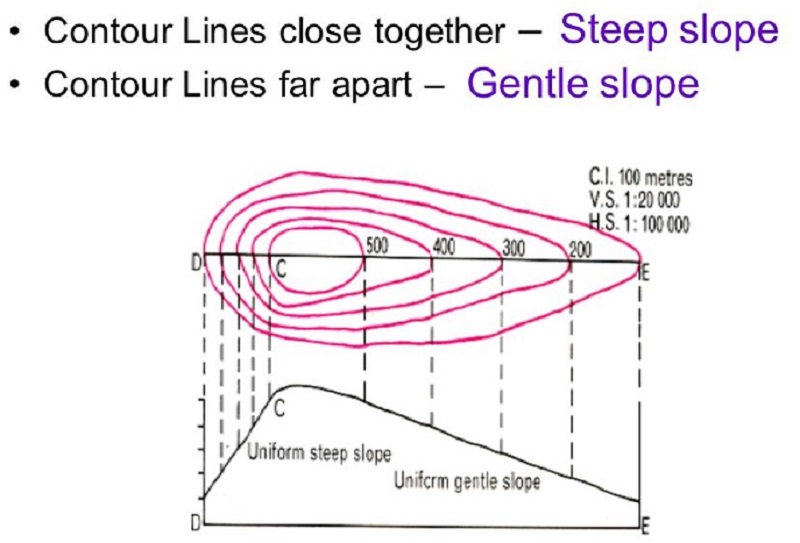
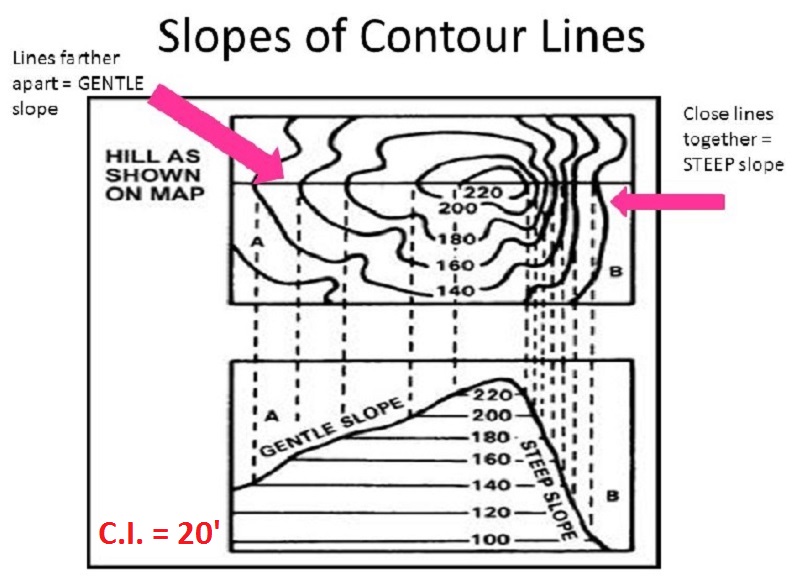
Contour lines close together = steep slope Contour lines far apart = gentle slope |
||||
|
|
||||
|
|
||||
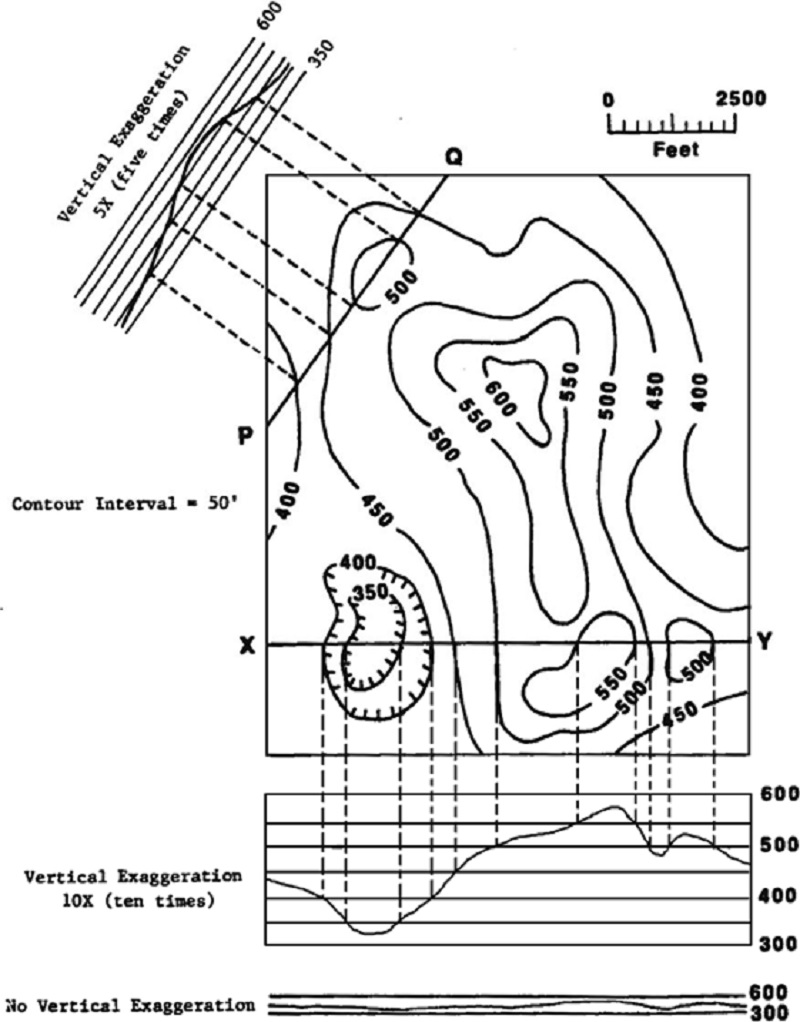
| Profile - A topographic profile is a cross-sectional view along a line drawn through a portion of a topographic map. One can think of a profile as a slice through a portion of the terrain (as you were slicing a cake and looking at the vertical face the slice). | ||||
|
|
||||
|
|
||||
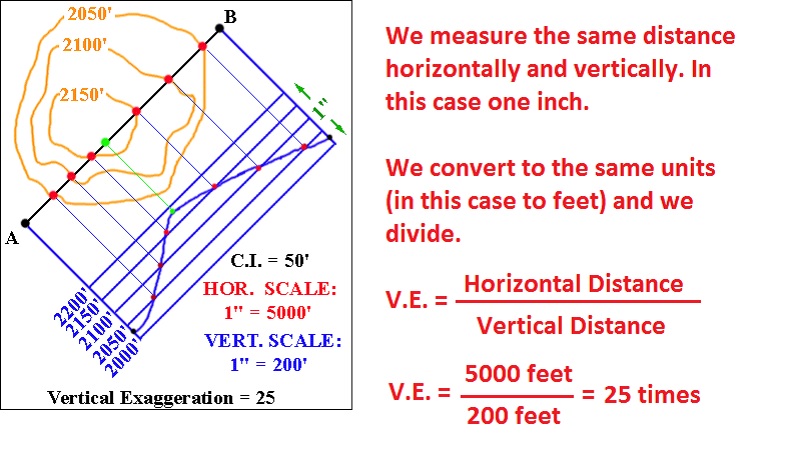
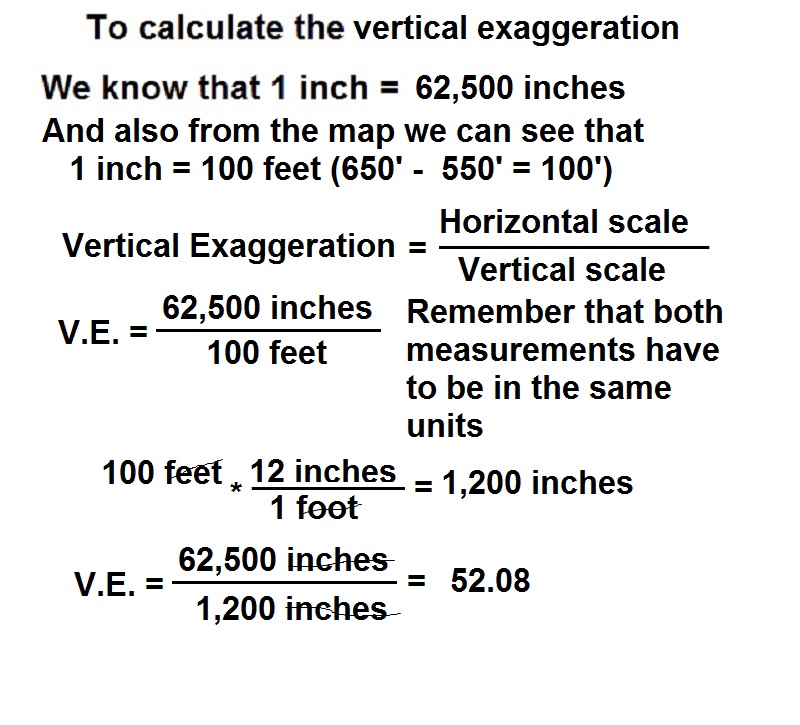
| Vertical Exaggeration - Vertical exaggeration is computed by dividing the horizontal scale of the map by the vertical scale of the profile. Both scales should be converted to the same units before dividing. | ||||
|
|
||||
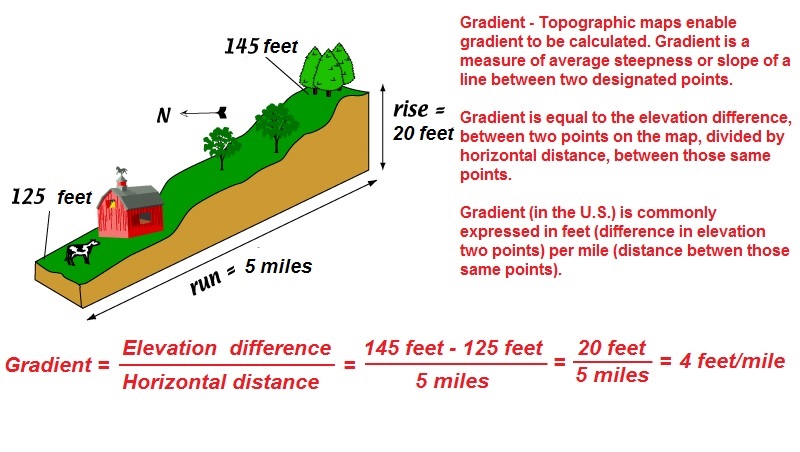
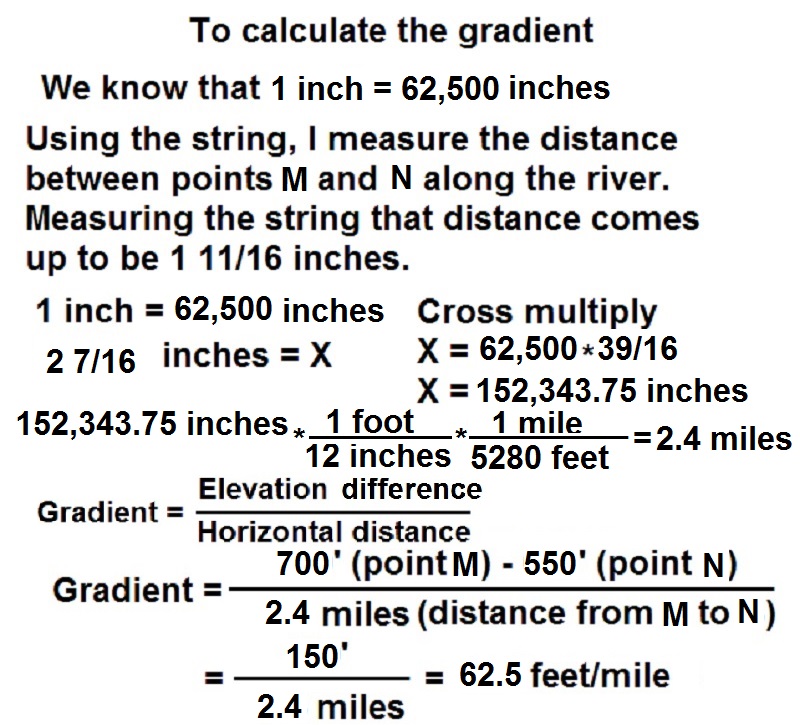
Gradient - Topographic maps are not just used for determining elevation, they can also be used to help visualize topography.One of the most basic topographic observation that can be made is the gradient (or slope) of the ground surface. High (or steep) gradients occur in areas where there is a large change in elevation over a short distance. Low (or gentle) gradients occur where there is little change in elevation over the same distance. Gradient is simply the rise over the run or the slope (change in y (elevation) divided by the change in x (distance)). Gradient is equal to the elevation change divided by the horizontal distance. |
||||
|
|
||||
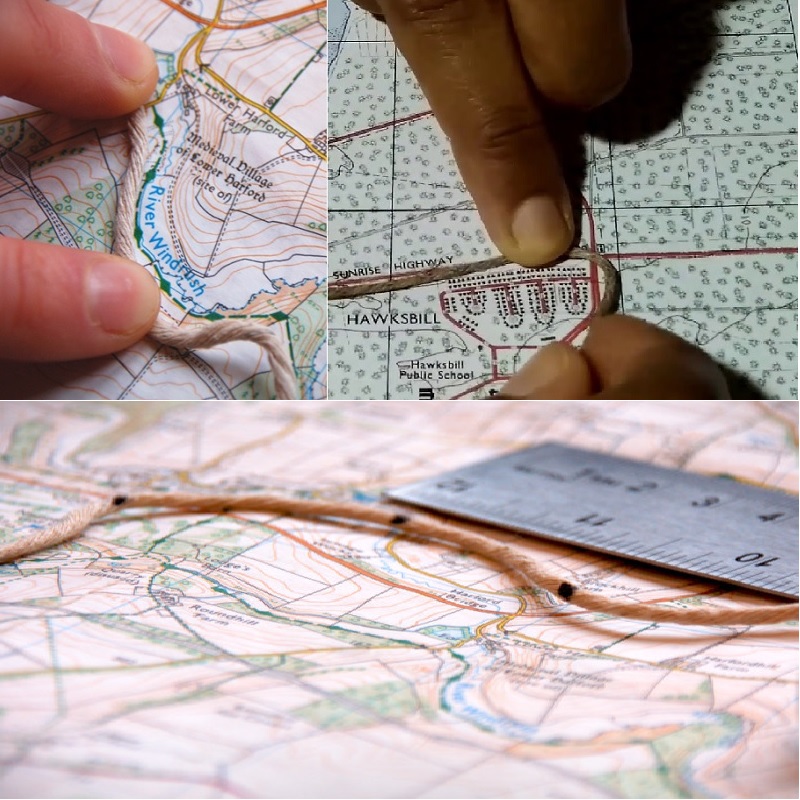
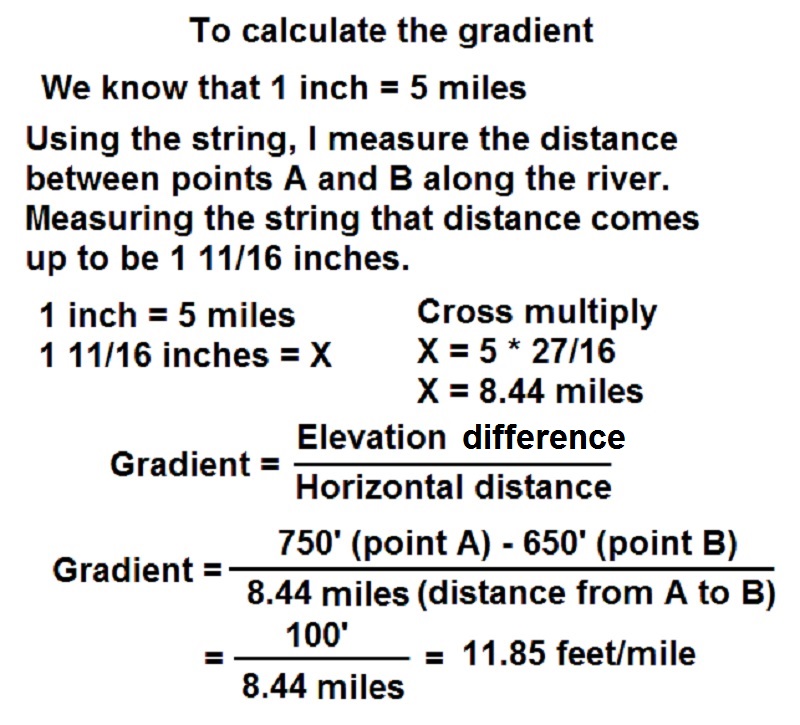
Since most rivers are curvilinear, we cannot use the ruler directly to measure their lenghts. Instead we have to take an additional step, that is we have to use a string and carefully lay the string along the curved lines that the river makes. Once we got that lenght on the string, then we go and measure that lenght against the ruler. Only then, we will have measured the true lenght along the bending lines of the river. |
||||
|
|
||||
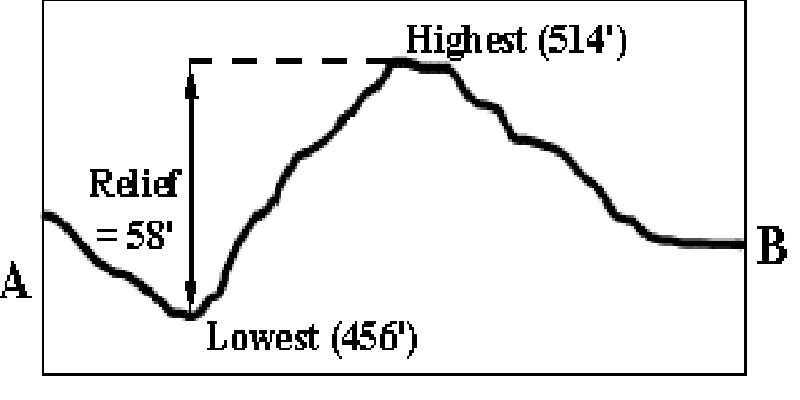
Relief - An important property of a landscape is its relief: the difference in elevation between the highest point and the lowest point |
||||
|
|
||||
|
|
||||
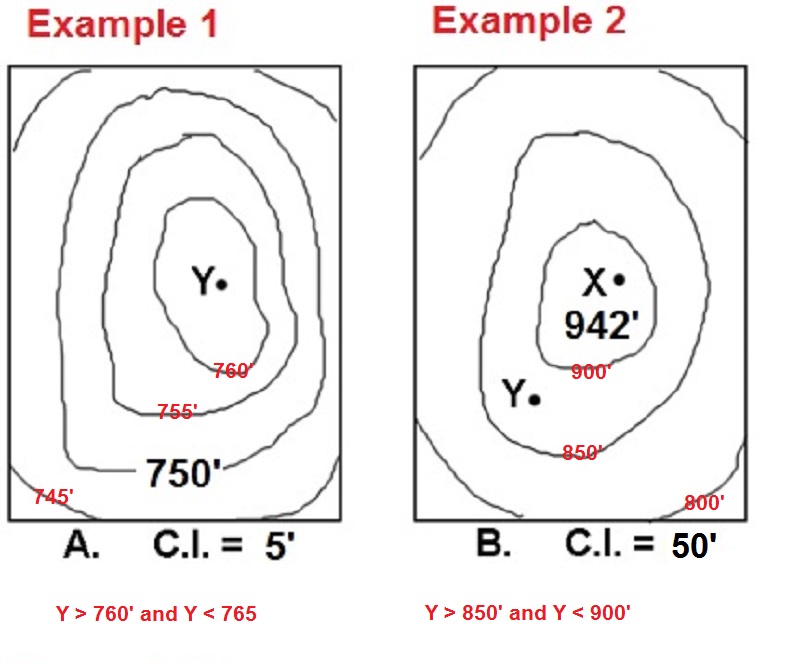
Examples 1 and 2 What is the value of Y? Example 1 - First we see the labeled contour at 750 feet and by the close contours we know we are going up towards Y at increments of 5 feet, given by the contour interval (C.I. =5'). Label the contours based on that information (values on red).From there we can see that Y is greater than 760 feet and less than the upcoming contour (not on the map) 765 feet. Y>760' and Y<765' Example 2 - First we see the we have a labeled point at X at 942 feet and by the close contours we know that we are going down towards Y at increments of 50 feet, given by the contour interval (C.I. =50'). Label the contours based on that information (values on red).From there we can see that Y is greater than 850 feet and less than 900 feet. Y>850' and Y<900' |
||||
|
|
||||
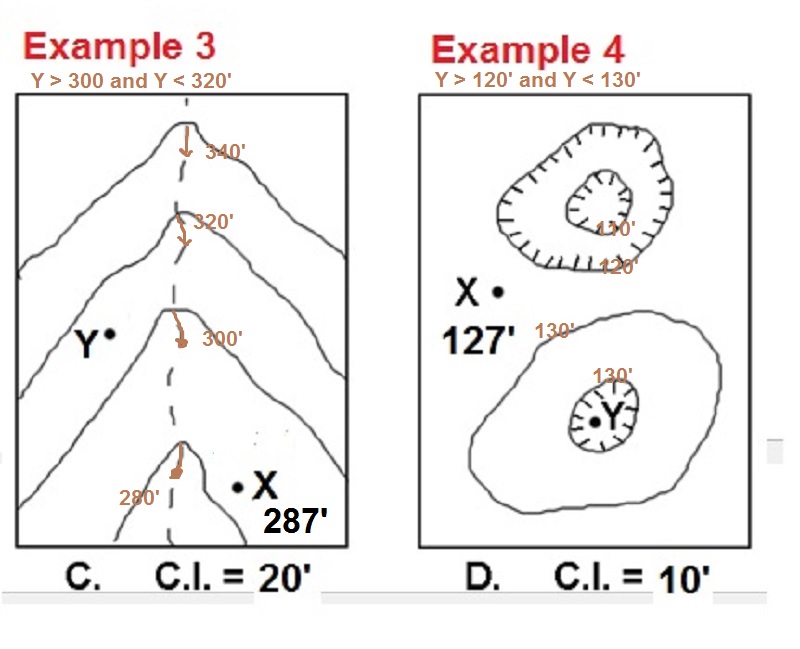
Examples 3 and 4 What is the value of Y? Example 3 - First we see the labeled point at X at 287 feet. Now what tells us which way is higher or lower are the Vs and the river (the dashed line is the river); we know that the vertex (uphill) of the V points North and the legs of the V (downhill) point South and from there we can infer that we we are going up towards Y at increments of 20 feet, given by the contour interval (C.I. =20'). Label the contours based on that information (values on red).From there we can see that Y is greater than 300 feet and less than 320 feet. Y>300' and Y<320' Example 4 - First we see the labeled point at X at 127 feet. Since we have a close contour we know that we have to go up by increments of 10 feet, given by the contour interval (C.I. = 10'). To label the next contour, we see that we have a hachure line and we are going down, but since we passed the contour 130 feet on our way up (we went a little bit above 130 feet) then we must pass the contour 130 feet again. Label the contours based on that information (values on red).From there we can see that Y is greater than 120 feet and less than 130 feet. Y>120' and Y<130' |
||||
|
|
||||
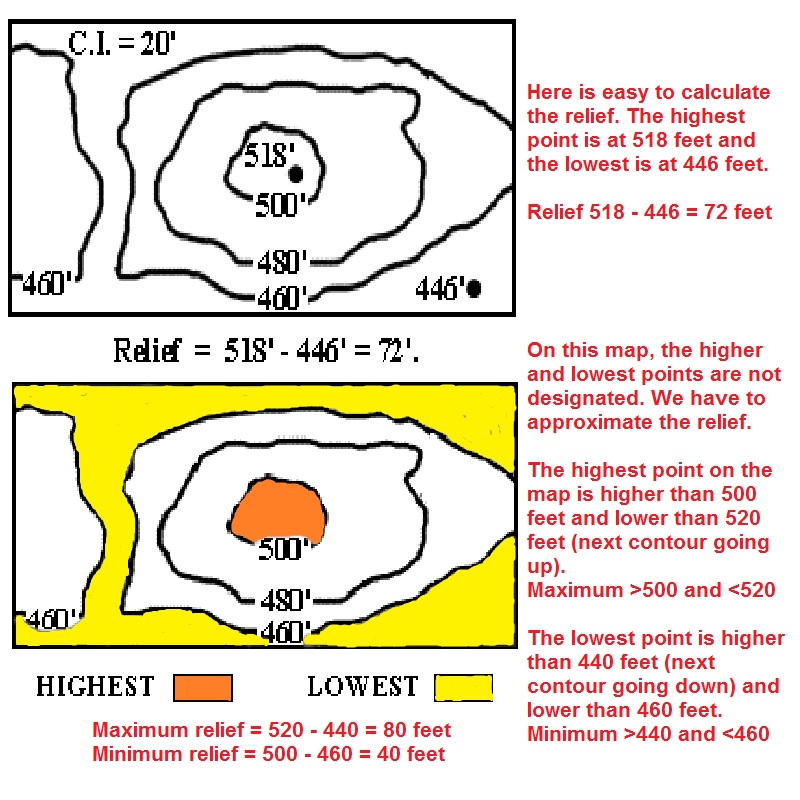
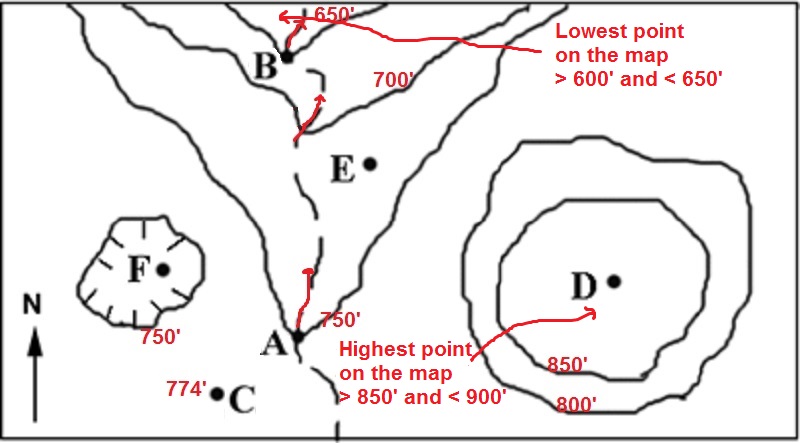
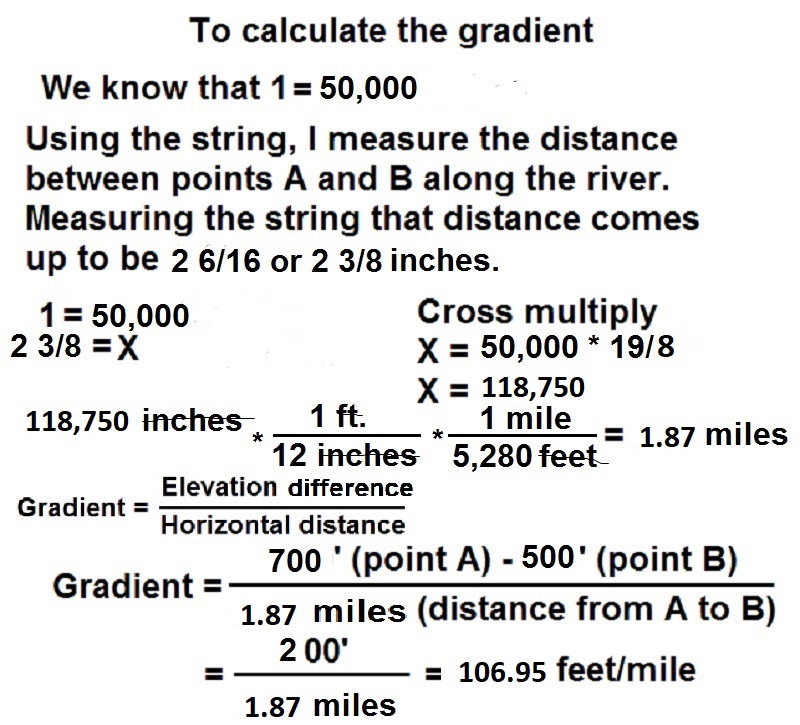
Example 5 For the map below, label all the contours; indicate the direction in which the stream flows; calculate the average gradient along the stream between points A and B; calculate the maximum and minimum relief on the map, and give possible elevations for points D, E and F. The dashed lines are streams. The scale is one inch = 5 miles. The C.I. is 50 feet. The elevation of point C is 774 feet. Label the contours - First determine where the stream is flowing (rule of Vs), so you can he see where are the high and low contours. Direction of stream flow - Water flows downhill, by looking at the map (the Vs) we can see that the stream is flowing North. Gradient between points A and B = 11.85 feet per mile (see calculations below). I used your lab manual to measure the lenght of the river. Point D > 850' and < 900' Point E > 700' and < 750' Point F > 700' and < 750' Maximum relief - Take the highest possible point about 900' and subtract the lowest possible point about 600'. 900' - 600' = 300'. The maximum relief is just less than: 300' Minimum relief - Take the remaining highest possible point and the lowest possible point 850' minus 650'. 850' - 650' = 200'. The minimum relief is just more than: 200' |
||||
|
|
||||
|
|
||||
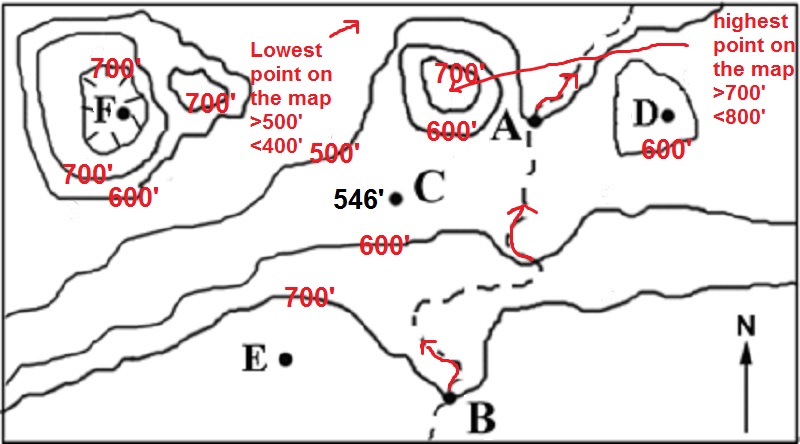
Example 6 For the map below, label all the contours; indicate the direction in which the stream flows; calculate the average gradient along the stream between points A and B; calculate the maximum and minimum relief on the map, and give possible elevations for points D, E and F. The dashed lines are streams. The scale is 1 = 50,000. The C.I. is 100 feet. The elevation of point C is 546 feet. Label the contours - First determine where the stream is flowing (rule of Vs), so you can he see where are the high and low contours. Direction of stream flow - Water flows downhill, by looking at the map (the Vs) we can see that the stream is flowing North. Gradient between points A and B = 266.67 feet per mile (see calculations below). I used your lab manual to measure the lenght of the river. Point D > 600' and < 700' Point E > 700' and < 800' Point F > 600' and < 700' Maximum relief - Take the highest possible point about 800' and subtract the lowest possible point about 400'. 800' - 400' = 400'. The maximum relief is just less than: 400' Minimum relief - Take the remaining highest possible point and the lowest possible point 700' minus 500'. 700' - 500' = 200'. The minimum relief is just more than: 200' |
||||
|
|
||||
|
|
||||
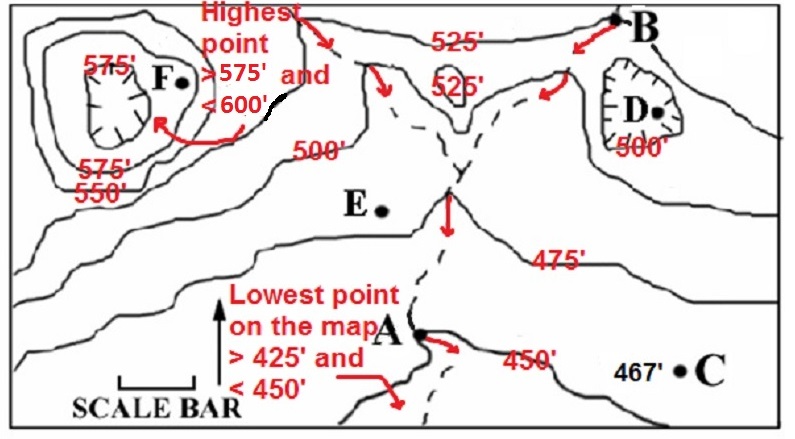
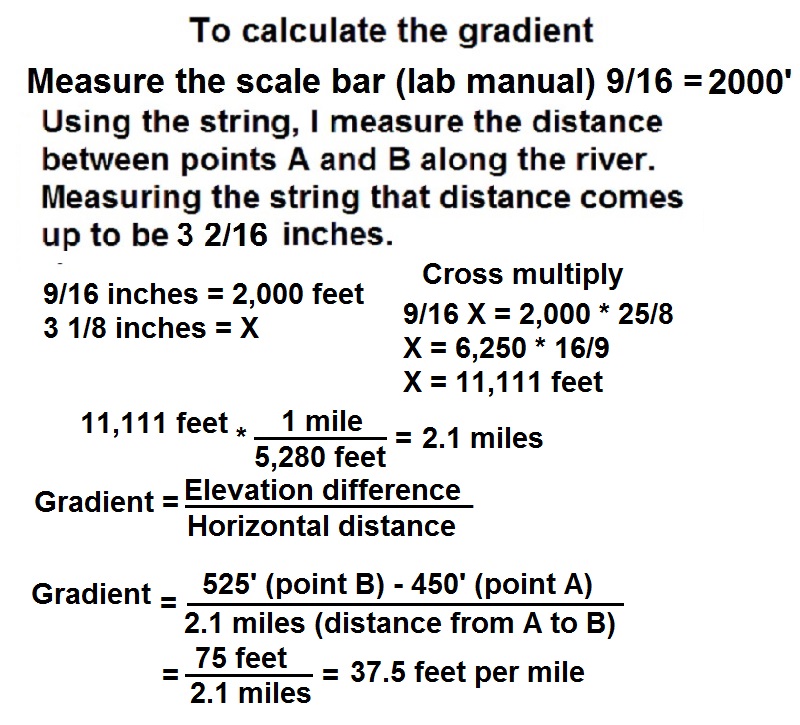
Example 7 For the map below, label all the contours; indicate the direction in which the stream flows; calculate the average gradient along the stream between points A and B, calculate the maximum and minimum relief on the map, and give possible elevations for points D, E and F. The dashed lines are streams. The lenght of the scale bar is 2000 feet. The C.I. is 25 feet. The elevation of point C is 467 feet. Label the contours - First determine where the stream is flowing (rule of Vs), so you can he see where are the high and low contours. Direction of stream flow - Water flows downhill, by looking at the map (the Vs) we can see that the stream is flowing South. Gradient between points A and B = 37.5 feet per mile (see calculations below). I used your lab manual to measure the scale bar and the lenght of the river. Point D > 475' and < 500' Point E > 475' and < 500' Point F > 575' and < 600' Maximum relief - Take the highest possible point about 600' and subtract the lowest possible point about 425'. 600' - 425' = 175'. The maximum relief is just less than: 150' Minimum relief - Take the remaining highest possible point and the lowest possible point 575' minus 450'. 575' - 450' = 125'. The minimum relief is just more than: 125' |
||||
|
|
||||
|
|
||||
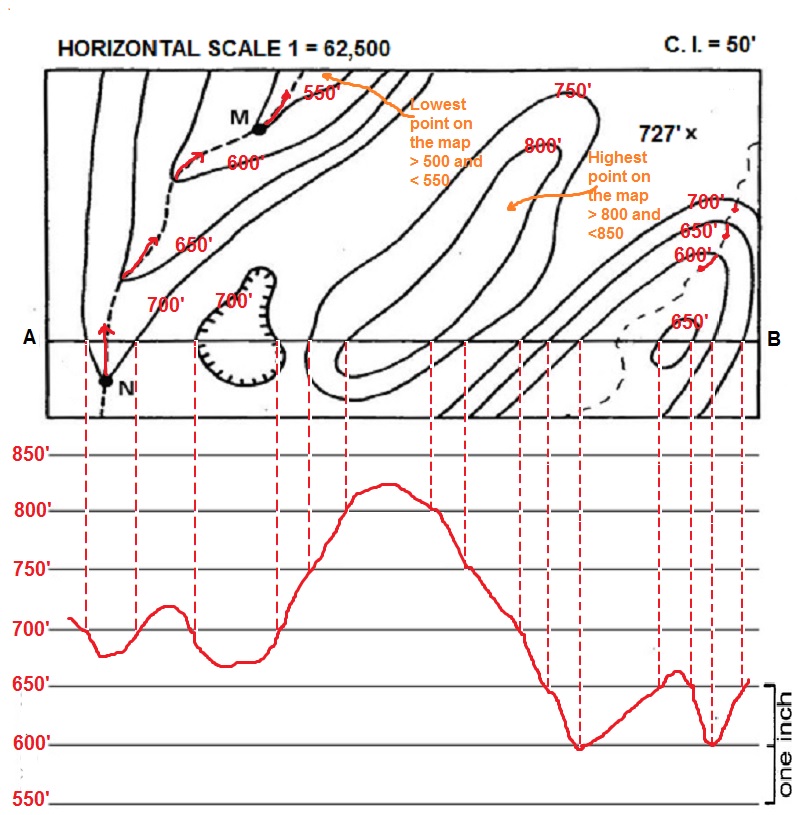
Example 8 For the map below, label all the contours; draw a profile along line A-B on the grid provided under the map; indicate the direction in which the stream flows; determine the vertical exaggeration of the profile; calculate the average gradient along the stream between points M and N; calculate the maximum relief of the map area.Note the one-inch scale provided for the profile. Dashed lines are streams. Horizontal Scale 1 = 62,500. The C.I. is 50 feet. The elevation of point X is 727 feet. Label the contours - First determine where the streams are flowing (rule of Vs), so you can he see where are the high and low contours. Draw a profile along line A-B - From each point that a contour line is touched by the line A-B, draw a perpendicular line onto the profile (make sure that line is straight and at exactly 90 degrees from the profile lines). See completed graph below. Direction of stream flow - Water flows downhill, by looking at the map (the Vs) we can see that the stream on the left is flowing Northeast and the stream on the right is flowing Southwest. Vertical exaggeration of the profile - By diving the horizontal scale by the vertical scale (bot measurements in the same units), we see that the VE = 52.08 (see calculations below). Gradient between points M and N = 62.5 feet per mile (see calculations below). I used your lab manual to measure the lenght of the river. Maximum relief - Take the highest possible point about 850' and subtract the lowest possible point about 500'. 850' - 500' = 350'. The maximum relief is just less than: 350' |
||||
|
|
||||
|
|
||||
|
|
||||
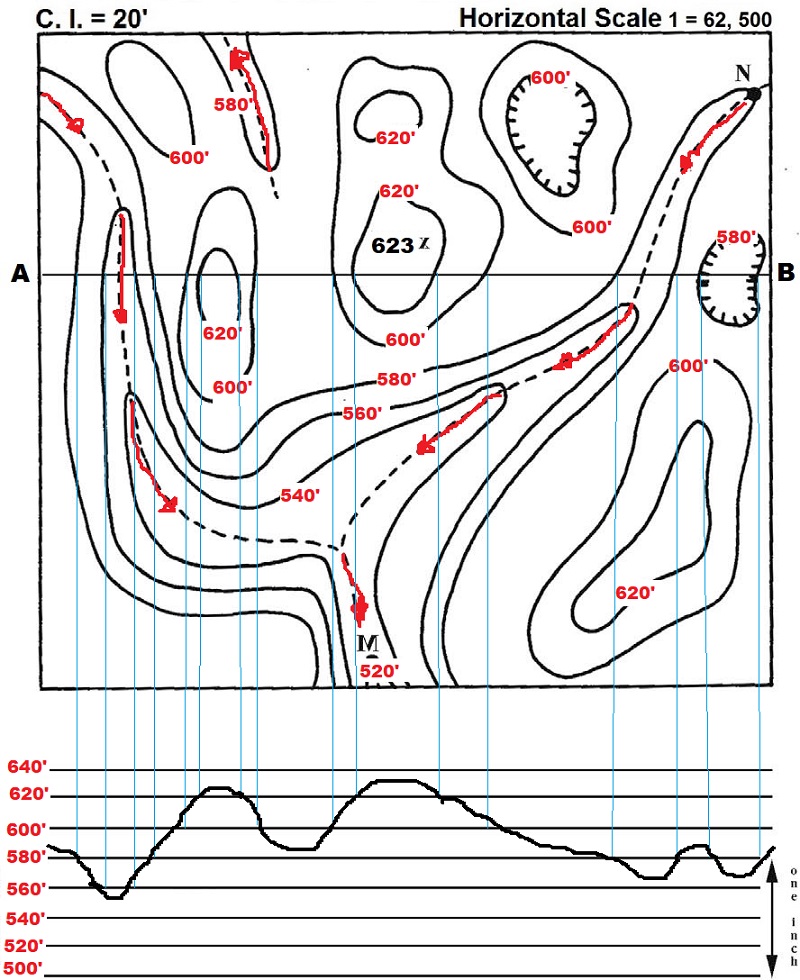
Example 8 For the map below, label all the contours; draw a profile along line A-B on the grid provided under the map; indicate the direction in which the stream flows; determine the vertical exaggeration of the profile; calculate the average gradient along the stream between points M and N; calculate the maximum relief of the map area.Note the one-inch scale provided for the profile. Dashed lines are streams. Horizontal Scale 1 = 62,500. The C.I. is 20 feet. The elevation of point X is 623 feet. Label the contours - First determine where the streams are flowing (rule of Vs), so you can he see where are the high and low contours. Draw a profile along line A-B - From each point that a contour line is touched by the line A-B, draw a perpendicular line onto the profile (make sure that line is straight and at exactly 90 degrees from the profile lines). See completed graph below. Direction of stream flow - Water flows downhill, by looking at the map (the Vs) we can see that both streams are flowing South. Vertical exaggeration of the profile - By diving the horizontal scale by the vertical scale (bot measurements in the same units). VE = 65.1 (perform the calculations and see if you can obtain the same number). Gradient between points M and N = 11.58 feet per mile (perform the calculations and see if you can obtain the same number). I used your lab manual to measure the lenght of the river. Maximum relief - The maximum relief is just less than: 140'(perform the calculations and see if you can obtain the same number). |
||||
|
|
||||
©David Leveson, C.E. Nehru, Guillermo Rocha - Brooklyn College - Earth and ENvironmental Sciences