Earthquakes
| Seismograph An instrument that detects and measures vibrations of Earths surface. | |
| Seismogram The record made by a seismograph. | |
|
|
|
|
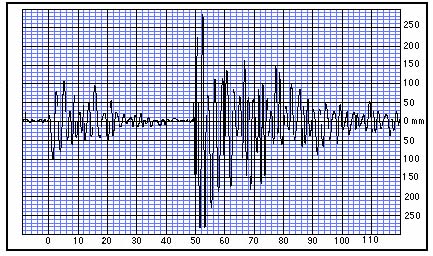
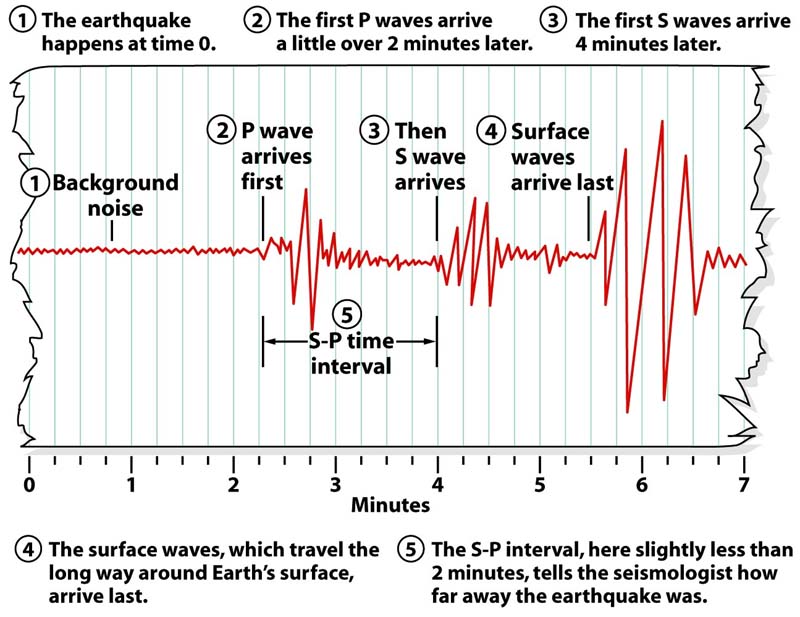
Seismogram - The picture above depicts a seismogram which is a written record produced by a seismograph. 1 Background noise - This is the type of record that the seismograph will produce when there is no action. 2 P waves arrive first - P waves travel twice as fast as the S waves. 3 S waves arrived second - S waves are called S for 2 reasons: they are the second wave to arrive (after the Primary wave), and they travel through solid materials (like most of the earth's interior) with a shearing motion. 4 Surface waves arrive last - Because of their larger amplitude surface waves always arrive last after the P and S waves. 5 SP time interval - This is the most important piece of information that can be collected from a seismogram. This interval will tell us how far away the earthquake is. For example in the graph above the SP interval is 1 minute and 45 seconds. |
|
|
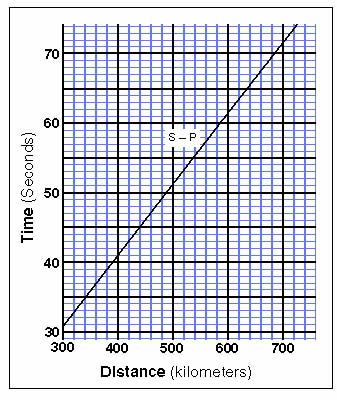
Once we have the SP time interval we can plot it in a graph and translate that time into the distance between the station that recorded the seismogram and the epicenter of the earthquake. |
 |
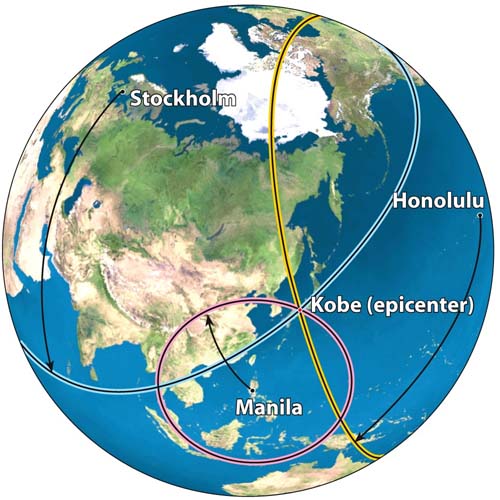
| Triangulation uses the three seismometers as centers of three different circles. Each circle has a radius that matches the distance measurement from the seismometer to the epicenter. By drawing three circles, each around a station, the point where the circles intersect is the epicenter of the earthquake. |
 |
| Besides showing you the arrival of of the different waves, a seismogram will also show you the amplitude of the waves so that the intensity of the earthquake could be also calculated. For this purpose we are only interested on the highest amplitude of the S (the second wave to arrive to the seismograph). For the seismogram to the right the amplitude of the S wave is about 270, and the SP interval is about 48 seconds, that is the difference in time from the arrival of the first P wave until the arrival of the first S wave.. |
 |
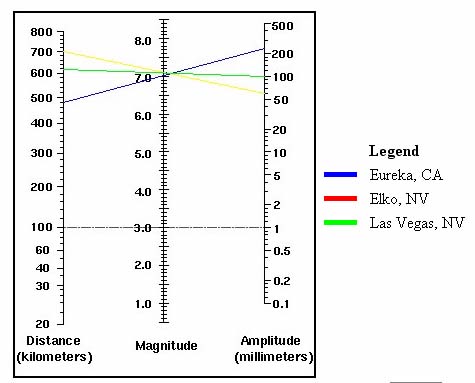
| A nomogram will help you to determine the magnitude (intensity) of an earthquake. The nomogram on the right gives the magnitude based in the Ritcher scale. Simply by creating lines between the distance from the earthquake to the amplitude of the S wave we could determine the magnitude of the earthquake. The magnitude is indicated where the three lines meet. |
 |
 |
 |
Brooklyn College - Geology Department