|
Views On Global Warming
SOURCE: The IPCC 'Introduction' Web Page (URL: http://www.gcrio.org/ipcc/qa/01.html)
INTRODUCTION
This document answers some of the most commonly asked questions about climate change, including whether the Earth has warmed, which human activities are contributing to climate change, what further climatic changes are expected to occur, and what effects these changes may have on humans and the environment. First, however, several issues are clarified: what the Earth's climate is, how climate differs from weather, and what processes influence climate.
Climate is the average weather, including seasonal extremes and variations, either locally, regionally, or across the globe. In any one location, weather can change very rapidly from day to day and from year to year, even within an unchanging climate. These changes involve shifts in, for example, temperatures, precipitation, winds, and clouds. In contrast to weather, climate is generally influenced by slow changes in features like the ocean, the land, the orbit of the Earth about the sun, and the energy output of the sun.
Fundamentally, climate is controlled by the long-term balance of energy of the Earth and its atmosphere. Incoming radiation from the sun, mainly in the form of visible light, is absorbed at the Earth's surface and in the atmosphere above. On average, absorbed radiation is balanced by the amount of energy returned to space in the form of infrared "heat" radiation. Greenhouse gases such as water vapor and carbon dioxide, as well as clouds and small particles (called aerosols), trap some heat in the lower part of the Earth's atmosphere. This is called the greenhouse effect. If there were no natural greenhouse effect, the average surface temperature would be about 34°C (61°F) colder than it is today.
Winds and ocean currents redistribute heat over the surface of the Earth. The evaporation of surface water and its subsequent condensation and precipitation in the atmosphere redistribute heat between the Earth's surface and the atmosphere, and between different parts of the atmosphere.
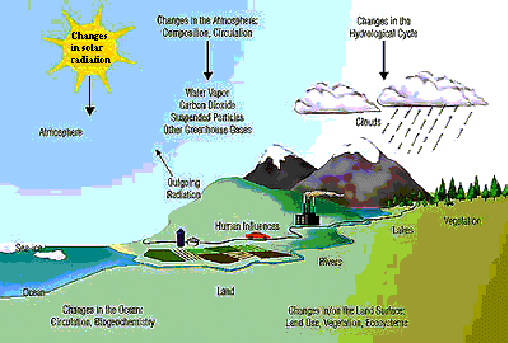
Figure 1.1
Schematic view of components of the global climate system, some of their processes and interactions, and some aspects that can cause climate change.
Natural events cause changes in climate. For example, large volcanic eruptions put tiny particles in the atmosphere that block sunlight, resulting in a surface cooling of a few years' duration. Variations in ocean currents change the distribution of heat and precipitation. El Nińo events (periodic warming of the central and eastern tropical Pacific Ocean) typically last one to two years and change weather patterns around the world, causing heavy rains in some places and droughts in others. Over longer time spans, tens or hundreds of thousands of years, natural changes in the geographical distribution of energy received from the sun and the amounts of greenhouse gases and dust in the atmosphere have caused the climate to shift from ice ages to relatively warmer periods, such as the one we are currently experiencing.
Human activities can also change the climate. The atmospheric amounts of many greenhouse gases are increasing, especially that of carbon dioxide, which has increased by 30% over the last 200 years, primarily as a result of changes in land use (e.g., deforestation) and of burning coal, oil, and natural gas (e.g., in automobiles, industry, and electricity generation). If current trends in emissions were to continue, the amount of carbon dioxide in the atmosphere would double during the twenty-first century, with further increases thereafter. The amounts of several other greenhouse gases would increase substantially as well.
The accumulation of greenhouse gases in the atmosphere due to human activities will change the climate by enhancing the natural greenhouse effect, leading to an increase in the Earth's average surface temperature. This warming may be partially offset in certain regions where air pollution leads to high concentrations of small particles in the atmosphere that block sunlight.
The current best estimate of the expected rise of globally averaged surface temperature relative to 1990 is 1 to 3.5°C (about 2 to 6°F) by the year 2100, with continued increases thereafter. Because most greenhouse gases remain in the atmosphere for a long period of time, even if emissions from human activities were to stop immediately, effects of accumulated past emissions would persist for centuries.
The Intergovernmental Panel on Climate Change (IPCC), cosponsored by the United Nations Environment Programme and the World Meteorological Organization and made up of over 2000 scientific and technical experts from around the world, published its First Assessment Report in 1990 and its Second Assessment Report in 1996. The Second report contains over 10,000 references and is over 2000 pages in length. Although our understanding of some details of climate change is still evolving, the IPCC report is the most comprehensive and scientifically authoritative account of our understanding of climate change, the potential impacts on humans and the natural environment, the technology currently available to reduce human influences on climate, and the socio-economic implications of possible measures to mitigate these changes. The document that follows has been written and reviewed by scientists who participated in the IPCC process, and it attempts to answer some of the most commonly asked questions about these issues, based upon information contained in the IPCC reports. A list of the scientists who prepared this document is provided inside the front cover.
HAS THE WORLD WARMED?
SOURCE: The IPCC 'Has The World Warmed' Web Page (URL: http://www.gcrio.org/ipcc/qa/02.html)
The globally averaged temperature of the air at the Earth's surface has warmed between 0.3 and 0.6°C (about 0.5 and 1°F) since the late nineteenth century (Figure 2.1).
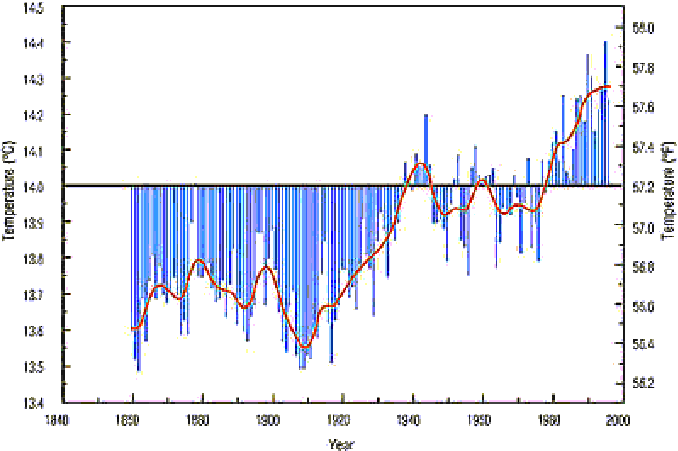
Figure 2.1
Measured global surface temperatures relative to the average for the 130-year period 1861 to 1990 (the horizontal line).
The four warmest years on record since 1860 have all occurred since 1990. The warming has been greatest at night over land in the mid-to-high latitudes of the northern hemisphere. The warming during the northern winter and spring has been stronger than at other seasons. In some areas, primarily over continents, the warming has been several times greater than the global average. In a few areas, temperatures have actually cooled, e.g., over the southern Mississippi Valley in North America (Figure 2.2).
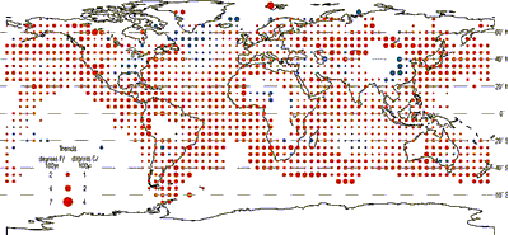
Figure 2.2
Trends in measured surface air temperature over the past century. Red circles represent warming; blue circles represent cooling. No data are available for the large areas with no circles.
Other evidence of global temperature increases since the nineteenth century includes the observed rise in sea level of 10 to 25 centimeters (about 4 to 10 inches), the shrinkage of mountain glaciers, a reduction of northern hemisphere snow cover (1973 to present), and increasing sub-surface ground temperatures. Data derived from measurements of tree rings, shallow ice cores, and corals, and from other methods of indirectly determining climate trends, suggest that global surface temperatures are now as warm as or warmer than at any time in the past 600 years.
Data from a few locations can be used to trace temperatures even further into the past. For example, deep ice cores and North Atlantic deep sea sediments suggest that the recent warming stands out against a record of relatively stable temperatures over the past ten thousand years, with century-to-century variations of temperature seldom approaching the observed increase of global mean temperatures of about 0.3 to 0.6°C (about 0.5 to 1°F) over the last century.
Satellite-based instruments have recently measured temperatures at higher altitudes (2 to 6 kilometers, or about 1 to 4 miles above the Earth's surface), rather than at the surface. These observations indicate that this portion of the atmosphere may have cooled slightly, by about 0.1°C (about 0.2°F), since 1979 when the measurements began. Although apparently at variance with the surface temperature measurements, they are not. Significant differences in short-term trends are to be expected between the surface and atmospheric temperatures at higher altitudes, because of the different factors affecting the variability and persistence of climate patterns at different altitudes. Furthermore, questions have recently arisen concerning the consistency of calibrations of the satellite-based instruments, suggesting that what was believed to be a small cooling may actually be a slight warming.
SOURCE: The IPCC 'Are Human Activities Contributing To Climate Change?' Web Page (URL: http://www.gcrio.org/ipcc/qa/03.html)
ARE HUMAN ACTIVITIES CONTRIBUTING TO CLIMATE CHANGE?
A comprehensive assessment by the IPCC of the scientific evidence suggests that human activities are contributing to climate change, and that there has been a discernible human influence on global climate.
Climate changes caused by human activities, most importantly the burning of fossil fuels (coal, oil, and natural gas) and deforestation, are superimposed on, and to some extent masked by, natural climate fluctuations. Natural changes in climate result from interactions such as those between the atmosphere and ocean, referred to as internal factors, and from external causes, such as variations in the sun's energy output and in the amount of material injected into the upper atmosphere by explosive volcanic eruptions.
Studies that aim to identify human influences on climate attempt to separate a human-caused climate-change factor (the signal) from the background noise of natural climate variability. Such investigations usually consist of two parts: detection of an unusual change, and attribution of all or part of that change to a particular cause or causes.
The concepts of detection and attribution may be understood in terms of a simple medical analogy. Measurement of a body temperature of 40°C (104°F) detects the presence of some abnormal condition or symptom, but does not in itself give the cause of the symptom. To attribute the symptom to an underlying cause often requires additional and more complex tests, such as chemical analyses of blood and urine, or even x-rays and CAT scans. Early work on climate-change detection examined changes in the globally averaged surface temperature of the Earth over the last century. Most studies of this type concluded that the observed increase of roughly 0.5°C (about 1°F) was larger than would be expected as a result of natural climate variability alone. Observed globally averaged temperature changes have also been analyzed away from the Earth's surface. The observations used come from conventional weather observing instruments (radiosondes) and from satellites. As expected, because of the different factors affecting the variability of and persistence of temperatures at different altitudes, there are noticeable differences between short-term trends at the surface and those at higher altitudes. The record of temperatures away from the Earth's surface, which spans only the past 40 years compared with the much longer surface record, is too short for globally averaged values to provide any definitive information about the extent of human influences.
The further step of attributing some part of observed temperature changes to human influences makes use of climate models, which have been employed to estimate the climatic effects of a range of human-induced and natural factors. The human factors include recent changes in the atmospheric concentrations of both greenhouse gases and sulfate particles (called "aerosols"). The natural factors considered include solar variability, the effects of volcanic eruptions, and internal variability of the climate system resulting from interactions among its individual components.
The changes in globally averaged temperature that have occurred at the Earth's surface over the past century are similar in size and timing to those predicted by models that take into account the combined influences of human factors and solar variability. To probe the question of attribution requires the application of more powerful and complex methods, beyond the use of global averages alone. New studies have focused on comparing maps or patterns of temperature change in observations and in models. Pattern analysis is the climatological equivalent of the more comprehensive tests in the medical analogy mentioned previously, and makes it possible to achieve more definitive attribution of observed climate changes to a particular cause or causes.
The expected influence of human activities is thought to be much more complex than uniform warming over the entire surface of the Earth and over the whole seasonal cycle. Patterns of change over space and time therefore provide a more powerful analysis technique. The basic idea underlying pattern-based approaches is that different potential causes of climate change have different characteristic patterns of climate response or fingerprints. Attribution studies seek to obtain a fingerprint match between the patterns of climate change predicted by models and those actually observed.
Comparisons between observed patterns of temperature change and those predicted by models have now been made at the Earth's surface and in vertical sections through the atmosphere (Figure 3.1). Model predictions show increasing agreement with changes observed over the past 30-50 years. The closest agreement occurs when the combined effects of greenhouse gases and sulfate aerosol particles are considered. Statistical analyses have shown that these correspondences are highly unlikely to have occurred by chance.

Figure 3.1
Modelled and observed changes in atmospheric temperature, from close to the Earth's surface to the lower stratosphere. Model results are from two sets of experiments: with "present-day" levels of atmospheric CO2 (panel a), and with present-day CO2, sulfur emissions, and stratospheric ozone depletion (panel b). They are given as changes relative to a pre-industrial state of the atmosphere. Observed changes (panel c) are temperature trends over the period 1963 to 1988, as estimated from weather balloons. All results are for annually averaged data and are in units of °C (panels a, b) and °C/25 years (panel c). The patterns of change in panels b and c are similar.
The agreements between the patterns of change predicted by models and those actually observed are due to similarities at large spatial scales, such as contrasts between the temperature changes in the northern and southern hemispheres or between different levels of the atmosphere. It is at these large scales that we have most confidence in model performance. More importantly, many of the results of these studies agree with our physical understanding of the climate system, and do not depend solely on numerical models or statistical techniques.
There are still uncertainties in these detection and attribution studies. These are due primarily to our imperfect knowledge of the true climate-change signal due to human activities, to our incomplete understanding of the background noise of natural climatic variability against which this signal must be detected, and to inadequacies in the observational record. Such uncertainties make it difficult to determine the exact size of the human contribution to climate change. Nevertheless, the most recent assessment of the science suggests that human activities have led to a discernible influence on global climate and that these activities will have an increasing influence on future climate.
SOURCE: The IPCC 'How Do We Know That The Buildup Of Greenhouse Gases Is Due To Human Activity' Web Page (URL: http://www.gcrio.org/ipcc/qa/05.html)
HOW DO WE KNOW THAT THE BUILDUP OF GREENHOUSE GASES IS DUE TO HUMAN ACTIVITY?
Four lines of evidence prove conclusively that the recent buildup of carbon dioxide arises largely from human activities.
The nuclei of carbon atoms in carbon dioxide emitted by burning coal, oil, and natural gas (fossil fuels) differ in their characteristics from the nuclei of carbon atoms in carbon dioxide emitted under natural conditions. Coal, oil, and natural gas were formed deep underground tens of millions of years ago, and the fraction of their nuclei that were once radioactive has long ago changed to non- radioactive carbon. But the carbon dioxide emitted from natural sources on the Earth's surface retains a measurable radioactive portion. As carbon dioxide has been emitted through fossil fuel combustion, the radioactive fraction of carbon in the atmosphere has decreased. Forty years ago scientists provided the first direct evidence that combustion of fossil fuels was causing a buildup of carbon dioxide and thereby diluting radioactive carbon in the atmosphere by measuring the decreasing fraction of radioactive carbon-14 captured in tree rings, each year between 1800 and 1950.
Secondly, scientists began making precise measurements of the total amount of carbon dioxide in the atmosphere at Mauna Loa, Hawaii, and at the South Pole in the late 1950s. They have since expanded their observations to many other locations. Their data show convincingly that the levels of carbon dioxide have increased each year worldwide. Furthermore, these increases are consistent with other estimates of the rise of carbon dioxide emissions due to human activity over this period.
A third line of evidence has been added since 1980. Ice buried below the surface of the Greenland and Antarctic ice caps contains bubbles of air trapped when the ice originally formed. These samples of fossil air, some of them over 200,000 years old, have been retrieved by drilling deep into the ice. Measurements from the youngest and most shallow segments of the ice cores, which contain air from only a few decades ago, produce carbon dioxide concentrations nearly identical to those that were measured directly in the atmosphere at the time the ice formed. But the older parts of the cores show that carbon dioxide amounts were about 25% lower than today for the ten thousand years previous to the onset of industrialization, and over that period changed little (Figure 5.1).
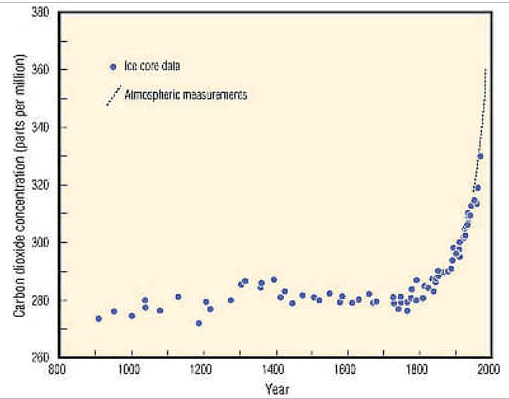
Figure 5.1
Measured amounts of carbon dioxide in the atmosphere.
The final line of evidence comes from the geographic pattern of carbon dioxide measured in air. Observations show that there is slightly more carbon dioxide in the northern hemisphere than in the southern hemisphere. The difference arises because most of the human activities that produce carbon dioxide are in the north and it takes about a year for northern hemispheric emissions to circulate through the atmosphere and reach southern latitudes.
Carbon dioxide is released to the atmosphere by a variety of sources, and over 95% percent of these emissions would occur even if human beings were not present on Earth. For example, the natural decay of organic material in forests and grasslands, such as dead trees, results in the release of about 220 billion tons of carbon dioxide every year. But these natural sources are nearly balanced by physical and biological processes, called natural sinks, which remove carbon dioxide from the atmosphere. For example, some carbon dioxide dissolves in sea water, and some is removed by plants as they grow.
As a result of this natural balance, carbon dioxide levels in the atmosphere would have changed little if human activities had not added an amount every year. This addition, presently about 3% of annual natural emissions, is sufficient to exceed the balancing effect of sinks. As a result, carbon dioxide has gradually accumulated in the atmosphere, until at present, its concentration is 30% above pre- industrial levels.
Direct atmospheric measurements of other human-produced greenhouse gases have not been made in as many places or for as long a period as they have for carbon dioxide. However, existing data for these other gases do show increasing concentrations of methane, nitrous oxide, and chlorofluorocarbons over recent decades. In addition, ice core data are available for methane and for nitrous oxide that demonstrate that the atmospheric concentrations of these gases began to increase in the past few centuries, after having been relatively constant for thousands of years. Chlorofluorocarbons are absent from deep ice cores because they have no natural sources and were not manufactured before 1930.
SOURCE: The IPCC 'What Climate Changes Are Projected?' Web Page (URL: http://www.gcrio.org/ipcc/qa/06.html)
WHAT CLIMATE CHANGES ARE PROJECTED?
The IPCC has projected further increases in globally averaged surface temperatures of 1 to 3.5°C (about 2 to 6°F) by the year 2100, as compared with 1990 (Figure 6.1). This projection is based on estimates of future concentrations of greenhouse gases and sulfate particles in the atmosphere.
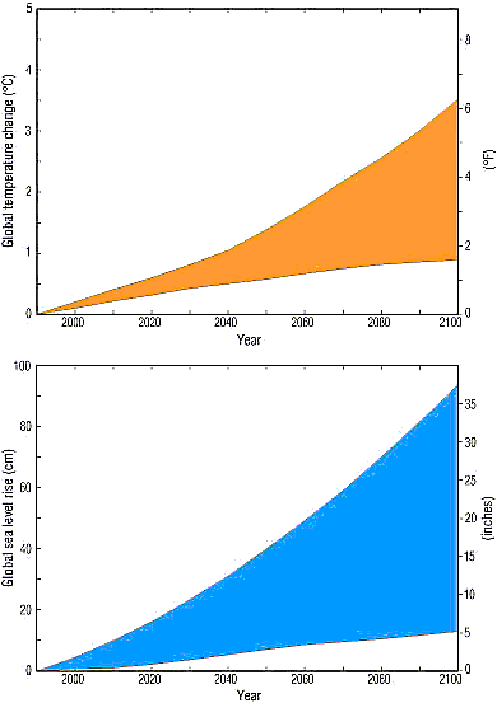
Figure 6.1
(top)The possible range of globally average surface temperature increase is shown for the period 1990 to 2100.
(bottom) The possible range of globally averaged sea level rise is shown for the period 1990 to 2100.
The average rate of warming of the Earth's surface over the next hundred years will probably be greater than any that has occurred in the last 10,000 years, the period over which civilization developed. However, specific temperature changes will vary considerably from region to region.
As a result of the warming, global sea level is expected to rise by a further 15 to 95 cm (about 6 to 37 inches) by the year 2100, because sea water expands when headed and some glacial ice will melt.
Although globally averaged surface temperature increases and sea level rise are the most certain of the IPCC projections, other effects can be projected with some confidence. Greater warming is expected to occur over land than over the oceans. The maximum warming is expected to occur in the Arctic in winter. Nighttime temperatures are expected to increase more than daytime temperatures. In general, there will probably be an increase in the number of very hot days at mid-latitude locations in summer, such as in most of North America, Europe, and parts of South America, with a decrease of very cold days in the same locations in winter.
Extreme events such as heavy rains and droughts are the most destructive forms of weather, and the frequency and duration of these events are likely to increase as the climate continues to change. Increases in the global averages of both evaporation and precipitation are expected. In winter at mid-latitudes, higher surface temperatures are expected to cause an increased portion of the precipitation to fall in the form of rain rather than snow. This is likely to increase both wintertime soil moisture and runoff, leaving less runoff for summer. In spring, faster snow melt is likely to aggravate flooding. In the summer, increased heating will lead to increased evaporation, which could decrease the availability of soil moisture needed both for natural vegetation and agriculture in many places, and increase the probability of severe drought. Droughts and floods occur naturally around the world, for example in association with El Nińo events, but are likely to become more severe, causing water management to become an even more critical problem in the future.
The most uncertain projections of future climate relate to changes in particular locales, as well as how weather events such as tropical storms, including hurricanes, typhoons, and cyclones, will be affected. This uncertainty results from the existence of large natural regional variations, as well as limitations in computer models and the understanding of the relationship between local and global climate at the present time.
The range of estimated warming of 1 to 3.5°C (about 2 to 6°F) by the year 2100 arises from uncertainties about the response of climate to the buildup of greenhouse gases and particles, as well as the total amount of future emissions of these gases. Factors such as estimates of human population growth, land use changes, life styles, and energy choices yield a range of plausible greenhouse gas emissions. For example, concerted efforts to reduce emissions of greenhouse gases would lead to a significantly lower projected temperature rise.
All of these predictions are based on the assumption that the global climate will change gradually. However, there is evidence to suggest that the Earth's climate has occasionally changed rather rapidly in the distant past. There may be similarly abrupt transitions due to human-induced climate change. These abrupt transitions raise the possibility of significant surprises as the world warms over the next century, perhaps with rapid and unexpected changes in ocean currents and regional climate. The likelihood that such rapid changes could occur increases with increasing emissions of greenhouse gases.
SOURCE: The IPCC 'How Reliable Are Predictions Of Future Change?' Web Page (URL: http://www.gcrio.org/ipcc/qa/07.html)
HOW RELIABLE ARE PREDICTIONS OF FUTURE CHANGE?
Predictions of climate change are calculated by means of computer models that mathematically simulate the interactions of the land, sea, and air, which together determine the Earth's climate. Our confidence in these models rests largely on their basis in accepted physical laws, their ability to describe many aspects of current climate accurately, and their skill at reproducing some of the important features of past climates.
Climate models are based on a wealth of scientific observations and well established laws of physics, including the laws of gravity and fluid motion, and the conservation of energy, momentum, mass, and water. It is this reliance on basic physical laws that lends high confidence to the prediction that a buildup of greenhouse gases will eventually lead to a significant alteration in the Earth's climate.
A second important reason for having confidence in climate models is because of their ability to reproduce many of the observed features of the atmosphere and ocean. For the purposes of predicting the behavior of the atmosphere for only a few days ahead, an atmosphere-only model, with no simulation of the ocean, can be used. This is the method employed in making short-term weather forecasts, whose relative accuracy demonstrates the ability of this sort of model to reproduce some of the important details of the atmosphere's behavior.
While reliable weather forecasts can only be made for periods up to ten days, predictability for greater lengths of time can be obtained for averages of weather, i.e., the climate. For example, with regard to longer periods (several years or more), climate models in which both the oceans and the atmosphere are represented are able to simulate the main features of current climate and its variability, including the seasonal cycle of temperature, the formation and decay of the major monsoons, the seasonal shift of the major rain belts and storm tracks, the average daily temperature cycle, and the variations in outgoing radiation at high elevations in the atmosphere as measured by satellites. Similarly, many of the large-scale features observed in the ocean circulation have been reproduced by climate models.
It is possible for a model to simulate current climate well but still fail in its prediction of climate change. So another test of models is to compare their simulations of earlier climates to historical data, including the climate of the past century (Figure 7.1). These efforts have been hampered by our imprecise knowledge of a variety of factors, including how humans have changed the amounts of small particles in the atmosphere and variations in the energy output of the sun.
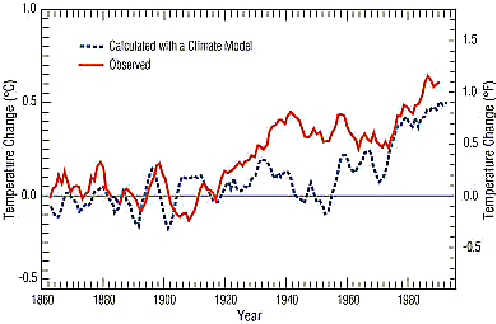
Figure 7.1
Calculated globally averaged surface air temperature is compared to observed values over the period 1860 to 1994.
Nevertheless, using estimates of some of these factors, climate models can reproduce many changes observed over the last century, including the global mean surface warming of 0.3 to 0.6°C (about 0.5 to 1°F), the reduction in temperature differences between day and night, the cooling in the atmosphere above about 14 km (about 9 miles), the increases in precipitation at high latitudes, the intensification of precipitation events in some continental areas, and a rise in sea level. Moreover, a climate model has correctly predicted broad features of the globally averaged surface cooling and subsequent recovery associated with the eruption of Mt. Pinatubo in 1991.
Climate models can also be used in attempts to reproduce the main features of prehistoric climates, but this effort has been limited by the scarcity and the indirect nature of the evidence available from sediment cores, tree rings, preserved pollen, and ice core data used to infer earlier climates. Even so, the models have reproduced some of the general features of reconstructed past climates, such as the enhanced North African monsoon 6000 to 9000 years ago, and the approximate level of cooling during the last ice age.
The major weakness of models is their reliance on approximations of some aspects of climate. It takes too much computer time, or is simply beyond the capacity of even supercomputers, to represent some of the key smaller-scale processes that affect climate. Even if adequate computers were available, scientists' understanding of the detailed physics of such processes is limited. So, some aspects of climate are approximated, based on a combination of physical laws, laboratory experiments, and direct observations of climate. For example, it is not possible to represent the details of the formation and dissipation of clouds. So, approximations are used. The approximation of cloud behavior is a major source of uncertainty in climate models.
In summary, the fact that models are based upon the known physical laws of nature and can reproduce many features of the current climate and some general aspects of past climates gives us increasing confidence in their reliability for projecting many large-scale features of future climate. However, there remains substantial uncertainty in the exact magnitude of projected globally averaged temperature rise caused by human activity, due to shortcomings in the current climate models, particularly in their representation of clouds. Furthermore, scientists have little confidence in the climate changes they project at the local level. Other uncertainties, not arising from specific limitations in the climate models, such as estimates of the rate of future greenhouse gas emissions, also restrict the ability to predict precisely how the climate will change in the future.
|