Visually Estimating
Mineral Percentages
![]()
| It is often
necessary to quantify the composition of a material. Determining the
percentage abundance of the constituent minerals is required to name
many rocks, and certainly determining the percentage abundance of
asbestos within a building material is essential for comparison with
legal limits.
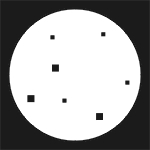
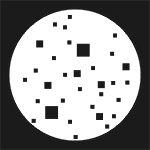
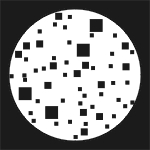
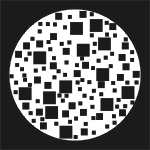
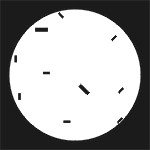
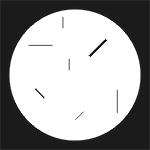
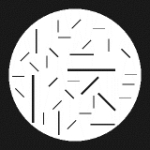
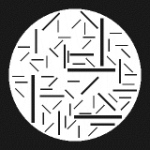
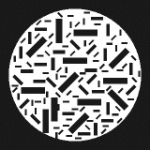
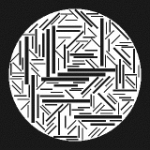
The fastest way to determine the percent abundance of the constituents within a microscope slide is to visually estimate the values. Although it is quick to do, visual estimation can be very imprecise, particularly to the untrained eye. The table below is a comparative reference to help you train your eye to visually estimate proportions more accurately.
|
|
Blocky |
Prismatic |
Fibrous |
|
| 1% |
|
|
|
| 5% |
|

|
|
| 10% |
|
|
|
| 25% |
|
|
|
|
To Open a Printer-Ready Copy of the Above Chart...
|
|||
![]()
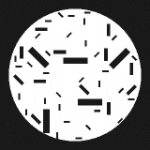
| The above examples focus on determining how much of the field of view (the circle) is filled with grains. But when it comes to asbestos analysis what matters more is what percentage contribution each grain type makes to the total volume of grains. |
| Examine the example below.
Twenty-five percent of the field of view is filled with fibrous grains.
Of this 25%, most of it is composed of black fibers (16% of the field of
view), with a lesser amount of orange fibers (6.5% of the field of
view), and even less blue fibrous material (only 2.5% of the field of
view)
Does this mean that the sample is composed of 2.5% blue fibers? No! The sample only fills 1/4 of the field of view. You would need 4x as much of the fibrous material to fill 100% of the field of view. In that case, if the sample comprised 100% of the view then there would be 4x as much material: 4x as much blue fibrous material, 4x as much orange fibrous material, 4x as much black fibrous material. So if the sample was 100% (4 x 25%), then the blue fibrous material would comprise 10% (4 x 2.5%) of the sample. |
|
Total Percent of Sample in Field of View: 25% |
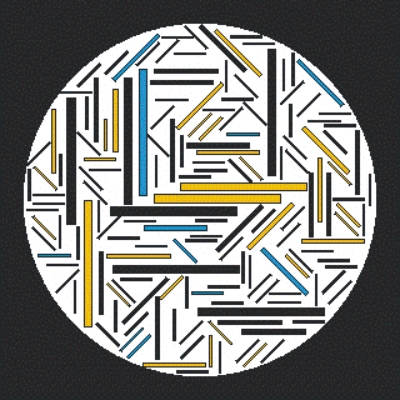 |
Total Percent of Fibers in Sample: 100% |
|
Black: 16% |
Black: 64% |
|
|
Orange: 6.5% |
Orange: 26% |
|
|
Blue: 2.5% |
Blue: 10% |