(click figure to enlarge)
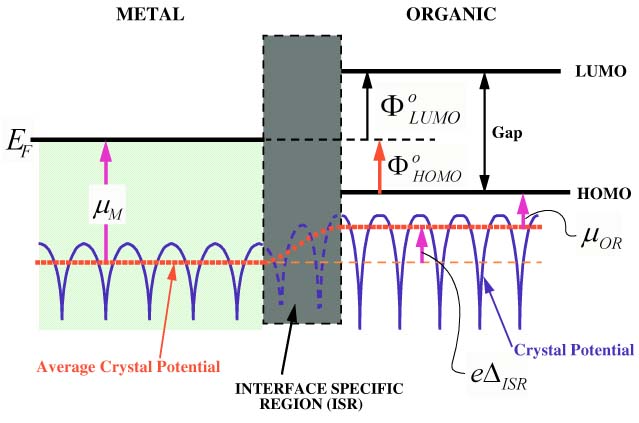
Fig. 1. The distribution of crystal potential, -eV(r) (solid blue lines) and energy levels (solid black lines) at a metal-organic interface. The average crystal potential is drawn as thick red dashed line.