D. BEHAVIORAL ADAPTATION
DINOSAUR RUNNING SPEED
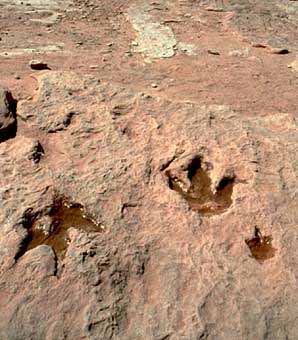
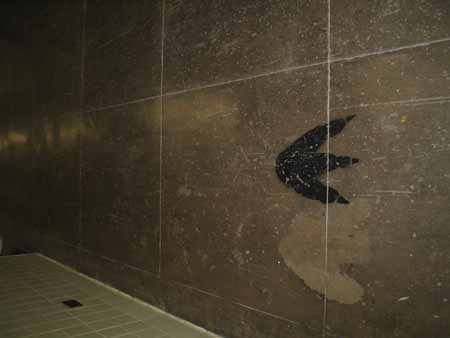
Many dinosaurs, probably most, had lifestyles or preferred habitats that brought them into contact with the shorelines of lakes, rivers or ocean. Some may have spent all their lives in such locales, while others may have only gone there occasionally to drink, find food, mate, or satisfy other life necessities. Some may simply have crossed bodies of water when migrating to a distant home range. For whatever reason they were there, these dinosaurs, like animals in such places today, left their footprints in the soft sand and mud of the beaches, banks and bars of the shoreline environments through which they traveled. Most of these footprints were undoubtedly quickly eradicated by shifting winds, tides, or sands. But many were not. Rapid burial of some prints by new layers of sediment protected them from later obliteration, and when these sediments were lithified, the footprints were preserved as impressions in the hard rock.
D1. STATEMENT OF PROBLEM: Analysis of dinosaur footprints and trackways (a series of footprints made by an animal as it moves forward) is a powerful tool in understanding important aspects of dinosaur behavior. For example, analysis of trackways in Cretaceous limestones of central Texas indicates that some sauropod dinosaurs (e.g. brontosaurs) traveled in herds, with the smaller juveniles in the center of the herd, and the larger adults posted on the periphery, presumably for protection of the young. This lab exercise illustrates how one can determine from trackways how fast one dinosaur was traveling.
D2. METHOD OF ANALYSIS: The approach we will take to resolve the question of dinosaur running speed is to analyze the size and spacing of dinosaur footprints, and to compare the results to data for living animals, whose running speeds we can observe and measure directly. The underlying premise is that as an animal runs faster, its legs swing in a wider arc, and its footprints will become more widely spaced. Footprint spacing thus increases with speed. If you think about how you walk and run, this relation between speed and stride, should become immediately obvious. For this reason, and because humans and the dinosaur in question are both bipedal (move on two legs), we can use humans as a modern analog for dinosaurs.
We will also have to concern ourselves with the fact that many dinosaurs are larger than most modern animals, including humans. We will, therefore, need a way to scale speed/size data for humans up to the size of dinosaurs. If we can find a scaling rule for doing this, then we can estimate dinosaur running speed from footprints preserved in rock.
In detail, our methodology will be:
A. Define & measure footprint and trackway parameters
B. Define & measure body dimensions useful in calculating running speed
C. Determine scaling rule relating running speed and body size
D. Calculate human & dinosaur running speed from trackway metrics & scaling rule
E. Evaluate accuracy of trackway analysis by comparing calculated measurements of human running speed
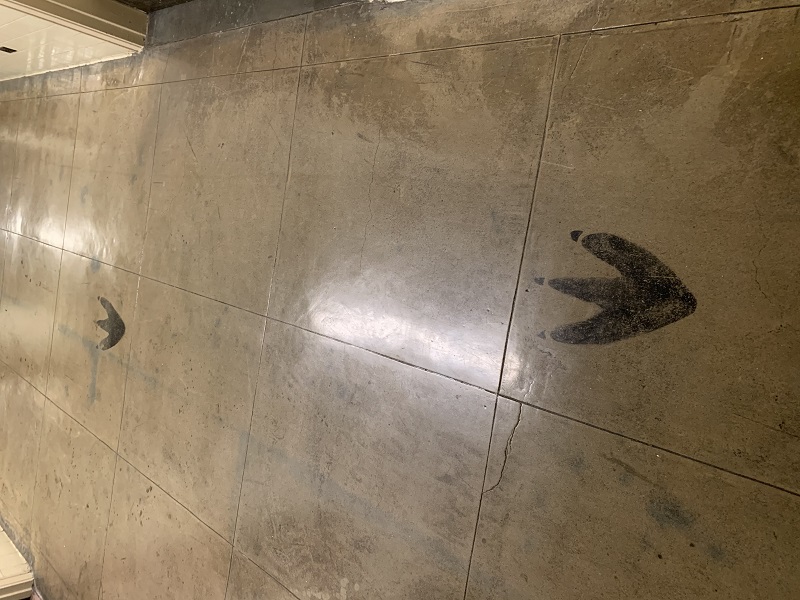
D3. DINOSAUR TRACKWAY: The corridor trackway below was made by placing cardboard sheets on top of real dinosaur tracks preserved in sandstones originally comprising the soft, wet shoreline sands of an ancient lake. The outline of a footprint was traced onto the cardboard, and the cardboard was then cut into the shape of the footprint. The cut-outs were used as templates to paint the trackway on the floor. The trackway reproduced in the hallway faithfully duplicates not only the shape and size of the footprints, but also their relative positions in the trackway. Thus, it records the actual steps made by an individual dinosaur as it moved across a mudflat at the edge of this ancient lake.
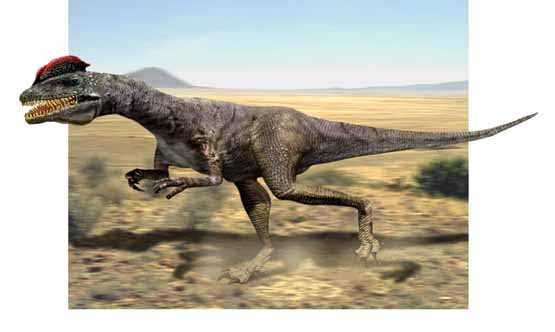
The trackway we will use was made by Dilophosaurus, a carnivorous dinosaur of the late Triassic (185 ma (mille annum, i.e. million years)). The original prints were found in Ryker Hill Park , Roseland , NJ . In appearance, Dilophosaurus resembles the more widely known Tyrannosaurus of the late Cretaceous (70 ma). The figure below diagrams the appearance of a typical dilophosaur. The animal that made our tracks was an adult approximately 20 feet long and weighing about 1000 pounds.We want to find the speed of our dilophosaur from the size and spacing of its footprints. To do this, you will need to keep in mind the posture of Dilophosaurus (see Figure below), and distinguish between its left and right feet.
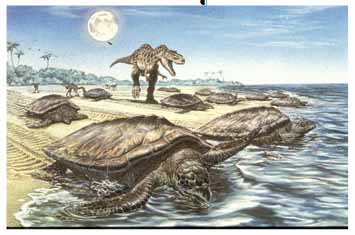
Dilophosaurus, like all carnivorous dinosaurs, had a bipedal posture, and thus walked on its back legs only. The front legs (arms and hands really) were used for grasping, not for walking (it is interesting to note that carnivorous dinosaurs, and humans and other primates, are the only animals to have evolved grasping hands). Notice that the body was held horizontally with the tail extending backwards to balance the weight of the body over the hips. Bipedal dinosaurs did not stand erect as bipedal humans do. The trackway reproduced in the corridor represents a sequence of left/right footfalls or steps made as the animal moved forward. Notice also that an individual footprint shows the impressions of only three toes. This is because carnivorous dinosaurs had bird-like three toed feet (like chickens and pheasants, carnivorous dinosaurs had a small backward pointing fourth toe, but this toe did not reach the ground, and left no indication of its presence in footprints).
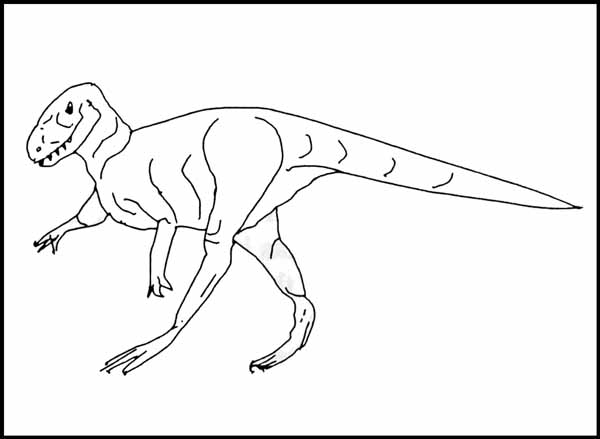
Sketch of Dilophosaurus.
D4. DEFINITION OF LOCOMOTOR PARAMETERS: To estimate running speed from the trackway, you will need to determine several important dimensions of the dilophosaur's body. The dimensions of interest include body parts (e.g., legs, feet) that are directly involved in locomotion. You will need to determine the same body dimensions for humans also. In particular, you will need to know: 1) foot length; 2) hip height (= leg length); and 3) stride length. These parameters are defined in Table 1, and in Figure 1. The data for humans will be used to check the accuracy of the method for calculating running speed in dinosaurs.
TABLE 1: Definition of dinosaur and human locomotor parameters
PARAMETER
|
SYMBOL
|
DEFINITION |
Foot Length |
F |
Length of foot from tip of longest digit to heel.
Measured as greatest front-to-back distance of a footprint.
|
Hip Height
|
H
|
Height of the hip joint above the ground. Hip height is equivalent to leg length, and is measured as the distance between the ground and the ball-and-socket joint of the hip.
|
Stride Length
|
S |
Distance between successive footfalls of the same foot. Stride length must not be confused with pace length which is the distance of a single step, i.e. the distance between footfalls of the left and right foot. Stride length generally equals twice the pace length.
|
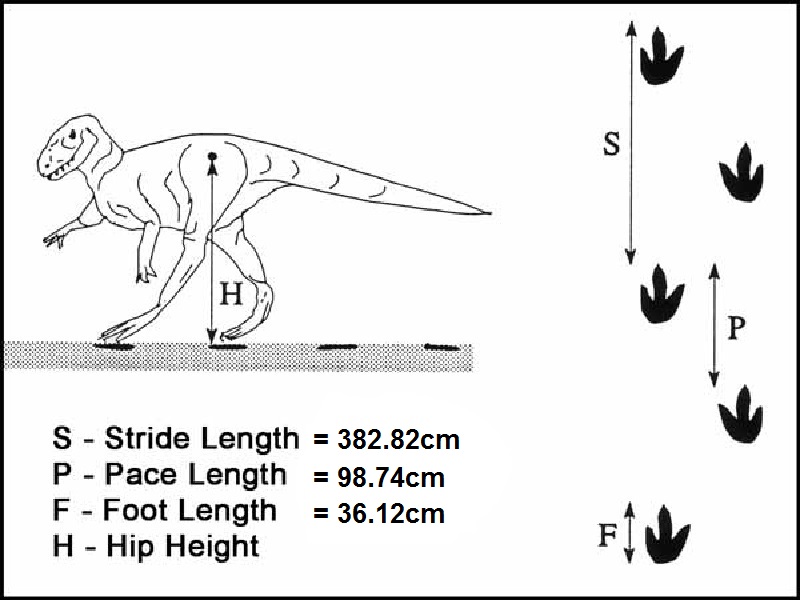
FIGURE 1: Definition of dinosaur locomotion parameters.
Hip height (H) can not be measured directly for our dilophosaur because the animal making the trackway was not preserved along with its tracks. But we can use equation 1, to estimate hip height from foot length (F):
Equation 1: H = 5 * F.
This relation has been verified for a variety of dinosaurs and modern vertebrates also. The equation states simply that hip height (or leg length) is about 5 times foot length in vertebrates (including dinosaurs) that walk and run on two legs.
D5. MEASUREMENT OF LOCOMOTOR PARAMETERS: Two tasks must be performed in order to successfully evaluate running speed in dinosaurs:
1) measure the locomotor parameters for Dilophosaurus from the footprints left on the rock record.
2) determine human speed by measuring locomotor parameters and running speed for humans.
D6. Dilophosaurus Locomotor Parameters: From Figure 1 get the measurements for foot length (F) and stride length (S) for Dilophosaurus . Record the results in the appropriate spaces in Table 2, below. Calculate hip height (H) using equation 1, and record this information in Table 2 also. Be sure to make all your measurements in the metric system.
TABLE 2: Locomotor data for dinosaurs and humans. Measured H – hip height as determined from measurement. Calculated H – hip height as calculated from foot length. N/A indicates measurements that cannot be made.
SPECIMEN
|
FOOT
LENGTH
(F) |
HIP HEIGHT
(H) |
STRIDE
LENGTH
(S) |
Measured H |
Calculated H
|
Dilophosaurus |
|
N/A |
|
|
Human
|
|
|
|
|
Table 2
D7. Human Locomotor Parameters: See Figure 2 below to find the average parameters for humans and enter the data in the appropriate spaces in Table 2.
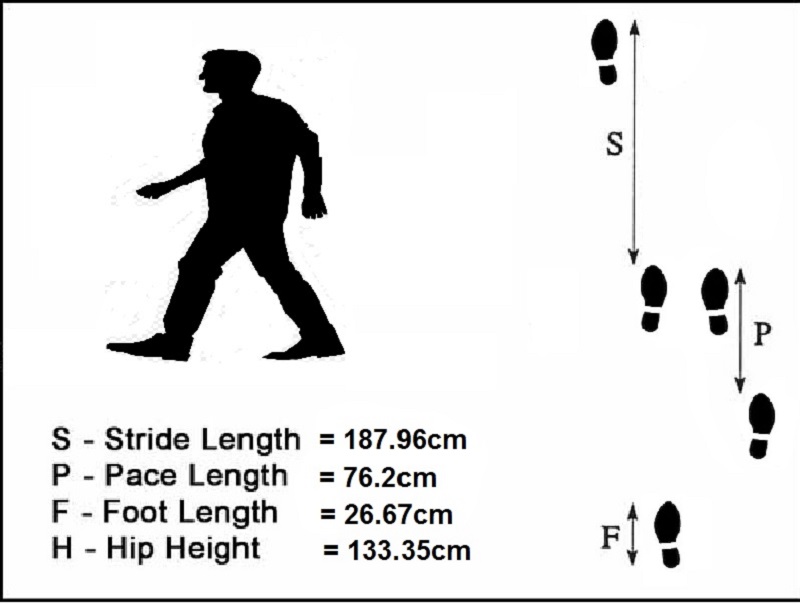
FIGURE 2: Definition of human locomotion parameters.
Foot Length: We measured the foot length from toe to heel. Record the data in the appropriate place in Table 2.
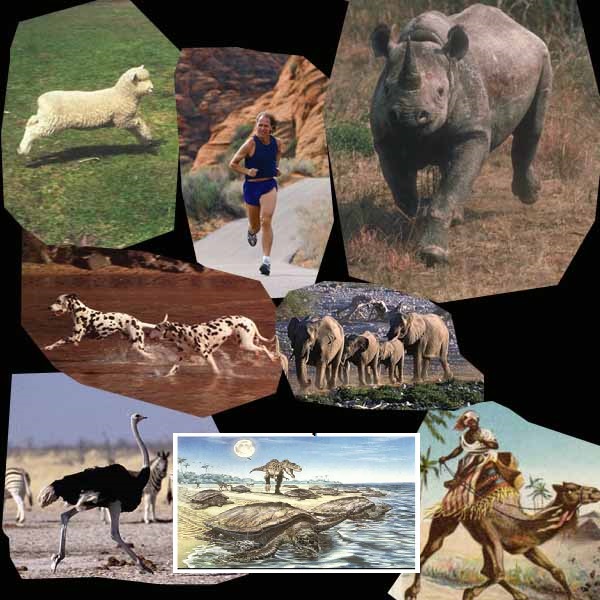
D8. DILOPHOSAUR RUNNING SPEED: We now have all the data needed to calculate running speed from foot length and stride length for the dilophosaur. However, we still need a way to account for the difference in size between Dilophosaurus and humans. One way to do this is to resort to an empirical relation of size and speed, derived from speed trials done on a diverse array of living animals. If the animals tested cover a wide size range, from mice to elephants for example, the resulting data set would incorporate data from animals both larger and smaller than humans and dilophosaurs. In this way, it should be possible to address the issue of size dichotomies between humans and our dilophosaur, and the effects of such on speed. Such data are plotted in Figure 3 below.

FIGURE 3: Size independent performance for animals listed in the legend. Relative stride length and dimensionless speed are defined in the text below.
We see in Figure 3, that the size/speed data plot very clearly along a straight line. The straight line thus defines the relationship between speed and size. Since the data include animals widely disparate in size, posture (some are bipedal, some quadripedal), and systematic status (birds and mammals), the relationship expressed by this line is probably a very robust one, and thus one we can feel confident about it in terms of estimating dilophosaur running speed.
There is a problem with Figure 3, however, and that is that the parameters shown on the X and Y axes of the graph are not ones we have yet dealt with. What, for example, is relative stride length, and what does dimensionless speed mean? These uncertainties need to be cleared up before we can finalize our results with regard to dilophosaur speed.
In essence, by using the parameters in Figure 3 rather than using simple size or speed, we can factor out the effect of size. The average human speed is about 3.65 meters per second (elite runners). In reality the sustained speed of a human will about half of this number. Thus, we define relative speed as:
Calculate the Relative stride of a human and dilophosaur using the equation below, then go to the graph on Figure 3 above and plotting the Relative Stride for each species on the x axis, get the Dimensionless Speed for each from the y axis.
Relative Stride Length = (Stride Length)/(Hip Height) = S/H. Eq. 2
and
Calculate the Relative stride of a human and dilophosaur using the equation below, then go to the graph on Figure 3 above and plotting the Relative Stride for each species on the x axis, get the Dimensionless Speed for each from the y axis. Using the equation below calculate the Actual Speed using the values found above.
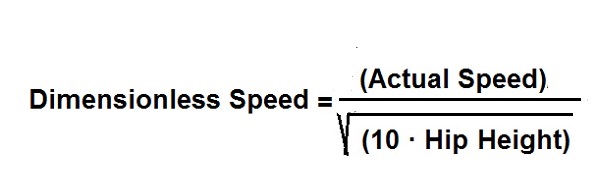
Eq. 3
Note that the denominator of this equation 3, involves a simple exponentiation, that is, you need to find the square root of 10 times hip height. Defining denominator in this way allows us to account for the influence of gravity which acts when an animal swings its leg forward when it moves. It is also crucial to stress that these equations only work, if you are using the metric system for your measurements (this is because 10 is the gravitational constant in the meter-kilogram-second system). If you are using anything except meters for distance, and meters/sec for speed, you will get incorrect results from these equations.
Calculate the relative stride length and dimensionless speed of the human from equations 2 and 3 above, and indicate his/her position in the plot in Figure 3 with a symbol different than used for the other animals plotted in this figure.
D8.1. Is the performance of your human runner comparable to that of the animals, including other humans, included in Figure 3?
Explain:
Now we can find the actual speed of the dilophosaur that made the corridor trackway. This may be done by calculating the relative stride length of the dilophosaur using equation 2, and then using Figure 3, and equation 3 to find its actual speed.
D8.2 What is the dilophosaur's relative stride length _____________________
D8.3 What is the dilophosaur's dimensionless speed ________________________
D8.4 What is the dilophosaur's actual speed ________________________
D8.5 CONCLUSIONS: What do the speed results for Dilophosaurus indicate about the concept that dinosaurs were slow, plodding creatures?
D8.6 What do the results indicate about your chances of escaping from a hungry dilophosaur if you were to meet one?
D8.7 POST-SCRIPT. Consider that a well-trained human athlete, capable of running a 4 minute mile is moving at only 15 mph, i.e., at a speed less than for our dilophosaur. Also, consider that we can't be sure that the dilophosaur was running at its top speed. Perhaps it could run even faster. After all, animals rarely can travel at their fastest when traversing the kind of soft, sticky river bank mud this dinosaur was trying to negotiate when it made these footprints (Can you run at your top speed on a beach?)
We see in this dichotomy in performance between dinosaurs and humans one reason why dinosaurs dominated terrestrial ecosystems during the Mesozoic Era, and why during these times, life was hard for small, defenseless mammals. It is perhaps somewhat comforting to know that dilophosaurs and humans never met. Dinosaurs became extinct more than 60 million years before the earliest human ( Homo ergaster ) appeared in central Africa .
Click here to go back to the main page
©J.A. Chamberlain, Jr. - Brooklyn College - Earth and Environmental Sciences