PROFILES
 | "Hey, Lulu! I'd really like to know how steep it's gonna be to go from one place to another!" |
 | "No problem! For a description in words of the steepness, you could figure out the gradient! Or, for a visual picture of the steepness, you can draw a PROFILE! Be kind enough, ladies and gentlemen, to cast your eye on this diagram on the right! In the left part of the diagram, in all its natural splendor, we have an oval hill with a depression on the top! And in the right part of the diagram, in the foreground, a hole! And in back of the hole, a hill! And last of all, two genuine paths (shown in blue)! One path from G to H! Another path from E to F!" | 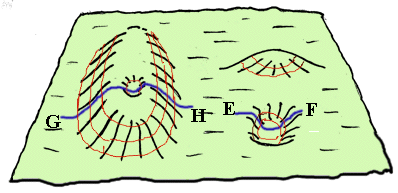 |
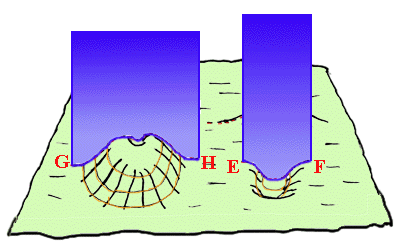 | "And now indulge me further, ladies and gentlemen! Hey, wake up, Lou! That includes you! Imagine a vertical slice cut down into the earth along each of the paths! Where the slice cuts the earth is is called a PROFILE or SECTION! Here I show two slices: one down through G to H and the other down through E to F! The profiles are the curved blue lines!" | | |
| "And now you lucky people, I'm going to show you how to draw a profile accurately so that you can see the steepness of the slopes! First, look below at Diagram 1, a 3-D sketch of the oval hill with the depression on the top, Diagram 2, a contour map of the same scene, and Diagram 3, an enlargment of the area around the depression contour in Diagram 2, slightly modified for clarity!" |
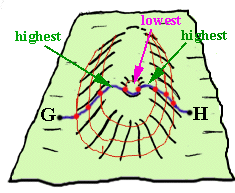
Diagram1 | 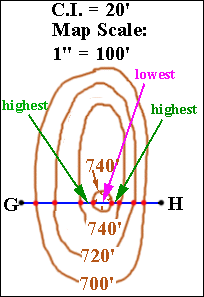
Diagram 2 | 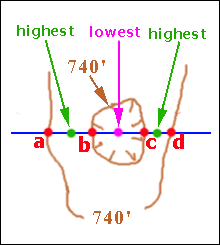
Diagram3 |
| "Now, look at the blue line G-H in Diagram 2, the line along which our slice into the earth is taken - the line of profile! We know the exact elevations of certain points along the line: those points (marked in red where the contours cross G-H! We know other important points approximately! Black dots G and H are more than 680' and less than 700'. The highest points along G-H lie on each side of the depression, somewhere between the two 740' contours, and are pointed to by green arrows. They may be seen more clearly in Diagram 3, where they are shown as green dots. One lies between red dots a and b; the other between red dots c and d. Each of the green dots has an elevation of more than 740' and less than 760'. The lowest point within the crater along G-H is marked with a purple dot. It is located somewhere between red dots b and c and has an elevation less than 740' and more than 720'." |
| "I sure like your use of colors, Lulu!" |
| | "OK! OK! At any rate, so we know that all the points along G-H must have elevations between 680' and 760'. We also know the contour interval (shown on the map) is 20'. Next, below the map I'm going to draw a grid made up of a set of lines parallel to G-H, one line for each possible contour line from 680' to 760'. The map scale tells me by what distance the lines should be separated on the grid. That is, it tells me what Grid Scale to use. If the map scale is 1 inch = 100 feet, then lines that are 20' feet different in elevation should be 1/5 inch apart on the grid. (Both the map scale and the grid scale are 1" = 100')" | 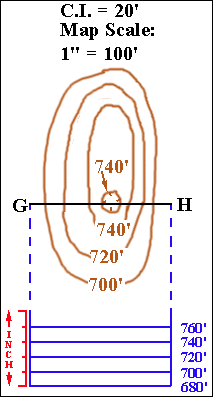 |
| | "Now from each of the points long G-H whose elevations I know exactly (the red dots) I'm going to drop lines straight down to the grid line which has that elevation! For those points along G-H whose elevations I only know approximately (the black, green and pink dots) I'm going to drop lines straight down to levels between the appropriate grid lines!" | 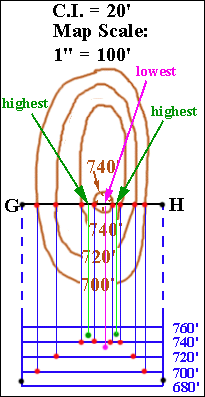 |
| | "And now you connect the dots!" | 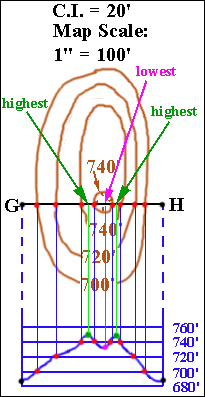 | | "Yes, you connect the dots with a SMOOTH CURVE that has the feel of the curve of the landscape!" | |
| | "And there you are! The profile is complete! You can pretty much see what it would be like to walk from G to H! And notice that as you go from down to up or up to down, the contours repeat themselves!" | 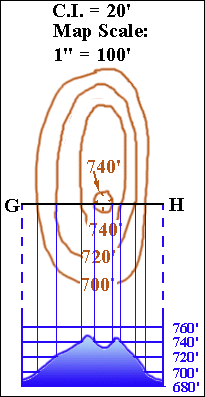 |
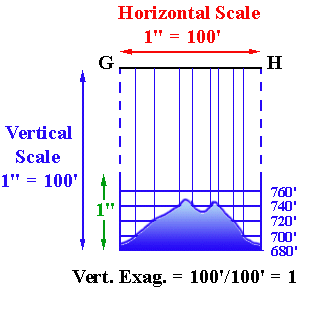 | | "On this profile you get a good idea of the steepness of the land because, on the grid, the scale for both the vertical and horizontal directions are the same: 1" = 100'. As a result, there's no distortion! What you see along the profile is pretty much what there is! There's no VERTICAL EXAGGERATION!" | |
| | "Awesome! But tell me more about this vertical exaggeration!" |
| "Go back to the 'Profiles Menu' and click on 'Vertical Exaggeration'!" |
|